Buying Nifty After It Falls: 152 Tests Across 30 Years Show the Same Thing
Over 30 years of Nifty data, 152 backtests examined whether buying intraday dips or overnight gap-downs could outperform a simple SIP. Different thresholds, execution rules, and fallback mechanisms were tested and every variation underperformed the SIP benchmark.

Can You Beat the SIP by Buying Nifty Dips? 30 Years of Data, 152 Tests, One Answer.
Everyone has had this thought at some point. The market falls. You feel the urge to do something smart: buy the dip, get cheaper units, compound better over time. It sounds sensible. So we tested it properly: two ways to measure weakness (intraday drawdowns and overnight gap-downs), two price reference points for each (the prior day's close vs. the day's open), two deployment regimes, and 19 thresholds from 0% to 4% for each. That's 152 combinations across 30+ years of Nifty data.
The SIP beat all of them.
What We Were Testing
The hypothesis behind every strategy here is the same: buying Nifty after a price drop should give you cheaper units and better compounding than buying mechanically every month. Two types of weakness were measured.
Intraday drawdowns look at how far the price fell during the session, either from the previous close to the day's low, or from that day's open to the day's low. Because the session low is only knowable after the market closes, any signal that fires must be acted on the next morning's open.
Overnight gap-downs look at how much the market opened below the previous close. The gap is visible the moment markets open, so execution happens at that same opening print.
Both drawdown and gap-down signals were measured in two ways: against the prior day's close (the CLOSE variant) and against the current day's open (the OPEN variant). The two variants produce slightly different XIRR numbers but near-identical trade counts and directions. They are two ways of sizing the same move.
The Setup
A bank account receives ₹10,000 on the first trading day of every month, compounding at 5% annualised on actual calendar days. When a signal fires above a set threshold, the full available bank balance deploys into Nifty at a 0.03% transaction cost. All purchased units are held permanently, with no selling and no rebalancing.
Two deployment rules were tested:
Version 1: Pure Signal: Money sits in the bank until a qualifying signal appears. If a month passes with no signal, cash stays idle and keeps earning 5%.
Version 2: Signal with Month-End Fallback: Same as above, but if no signal fires by the last trading day of the month, the full bank balance deploys at that closing price regardless. No month ends with idle capital.
Both were tested against a benchmark SIP: ₹10,000 on the first trading day of each month, 0.03% transaction cost, no bank account, no timing. Over 30+ years, the SIP delivered 12.04% XIRR and grew ₹36.1 lakh of contributions into ₹3.11 crore.
Part 1: Pure Signal Timing (No Fallback)
Intraday Drawdowns
Both the CLOSE and OPEN variants of the drawdown signal were tested across all 19 thresholds. All 38 combinations underperformed the SIP over 30 years.
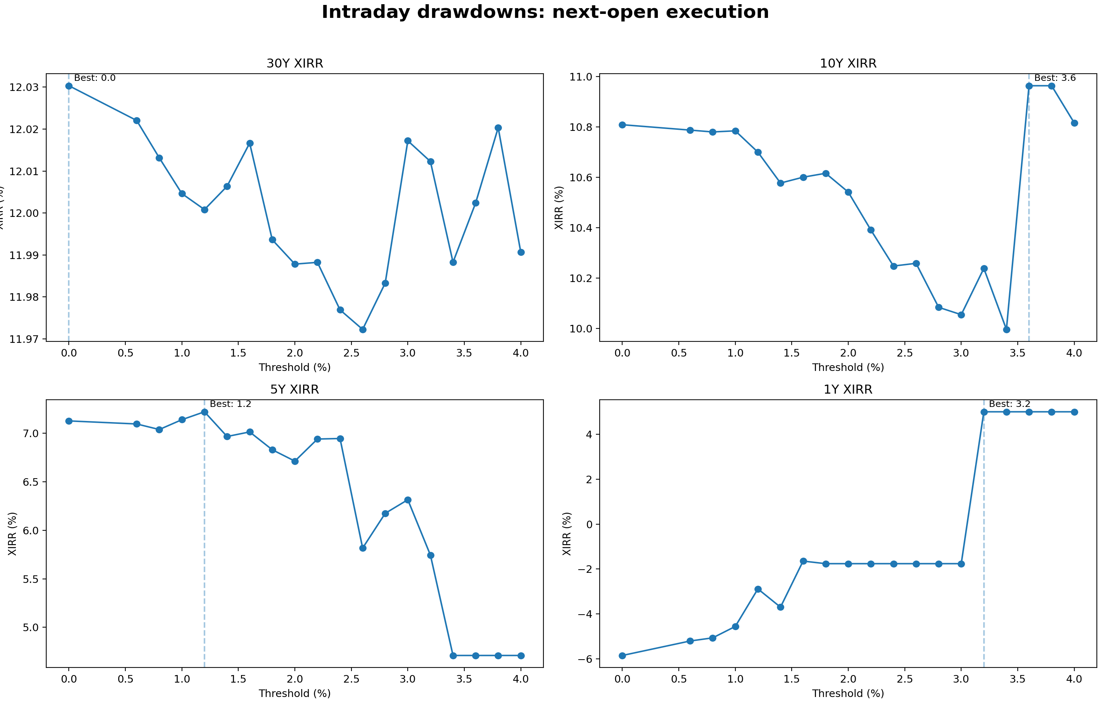
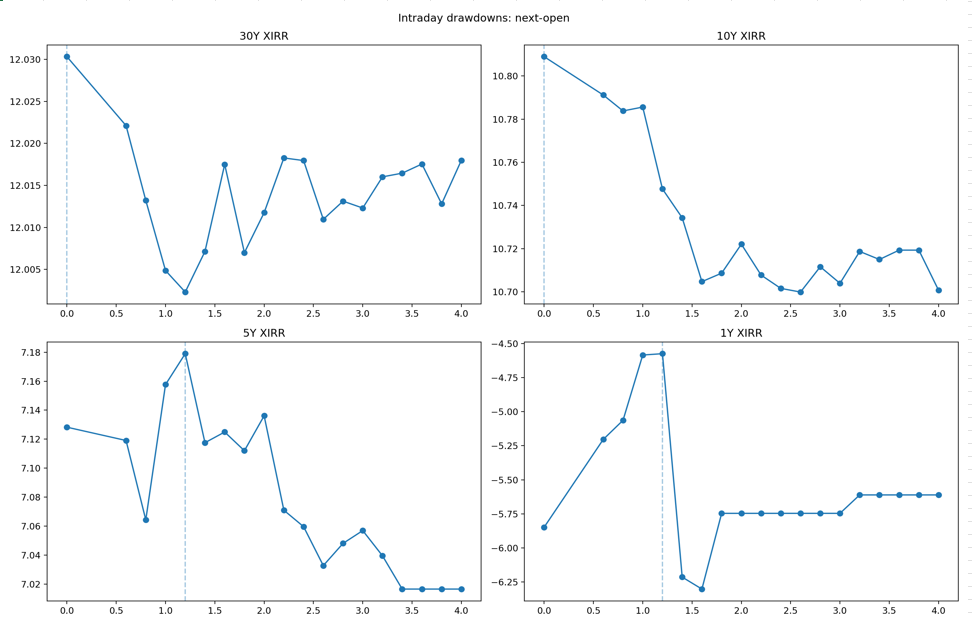
Dashboard: Intraday Drawdown (Open variant) - Pure Signal, No Fallback
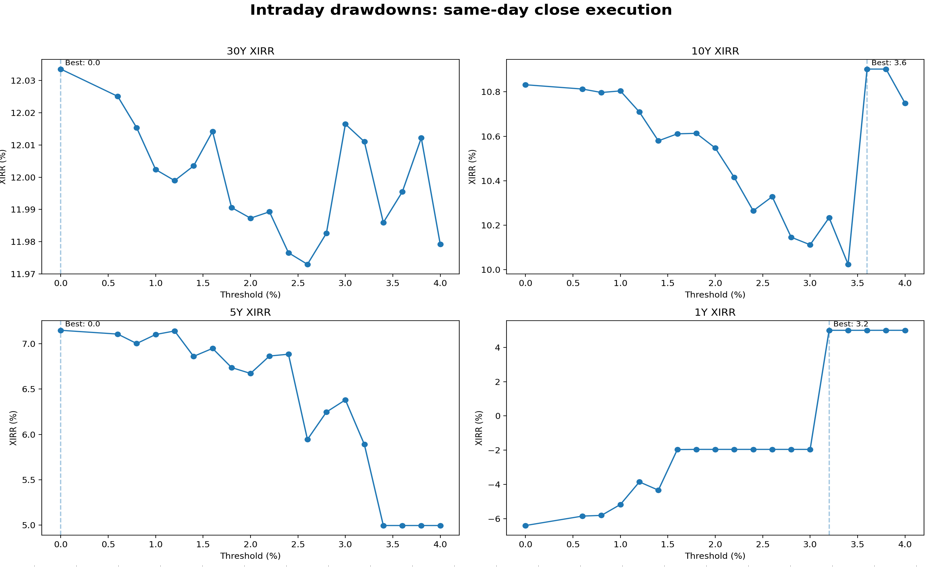
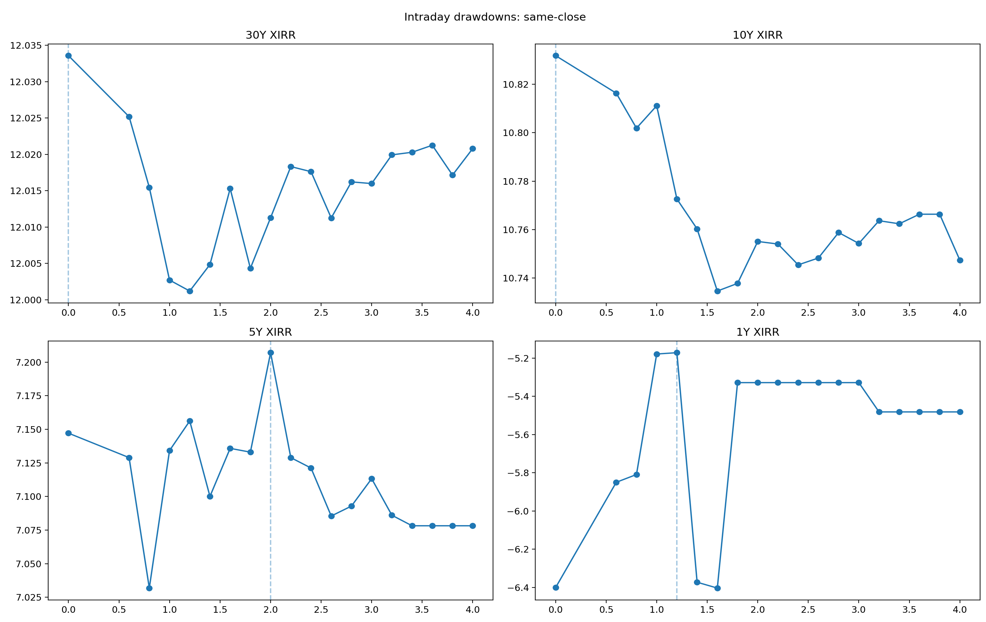
Dashboard: Intraday Drawdown (Close variant) - Pure Signal, No Fallback
At 0% threshold, the signal fires on virtually every trading day. Since the bank deploys fully on the first trigger each month, this collapses to approximately one trade per month, nearly identical in structure to the SIP. The result reflects that: XIRR of 12.03% vs SIP's 12.04%, trailing by just ₹49,000 (Close variant) and ₹69,000 (Open variant) over 30 years.
As the threshold rises, the gap widens, but not dramatically. The worst-case loss for the drawdown strategy is around ₹4.2 lakh behind the SIP (CLOSE at 2.6%, OPEN at 2.6%), and it never gets catastrophic. Trade counts fall from 361 at 0% to 65 at 4.0%, and at the highest thresholds, ₹2.41 lakh sits idle in the bank at period end, earning 5% while the market compounded at 12%.
The pattern is consistent across both variants: more selective entry criteria produce worse outcomes. The intraday dip, whether measured from the prior close or the same-day open, carries no predictive information about the next morning's price.
Overnight Gap-Downs
Both CLOSE and OPEN gap-down variants were tested across 19 thresholds. All 38 combinations underperformed. But here, the losses aren't gradual. They fall off a cliff.
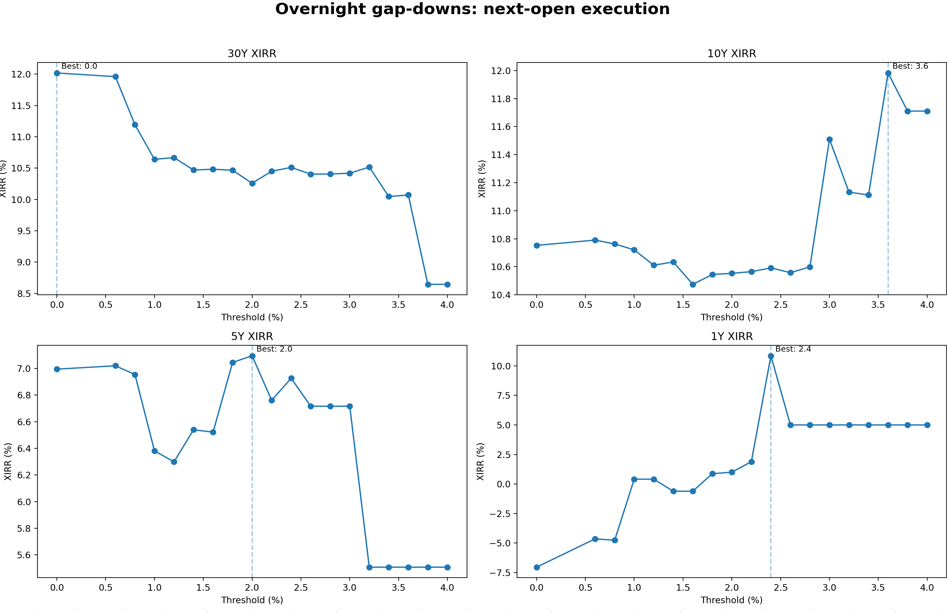
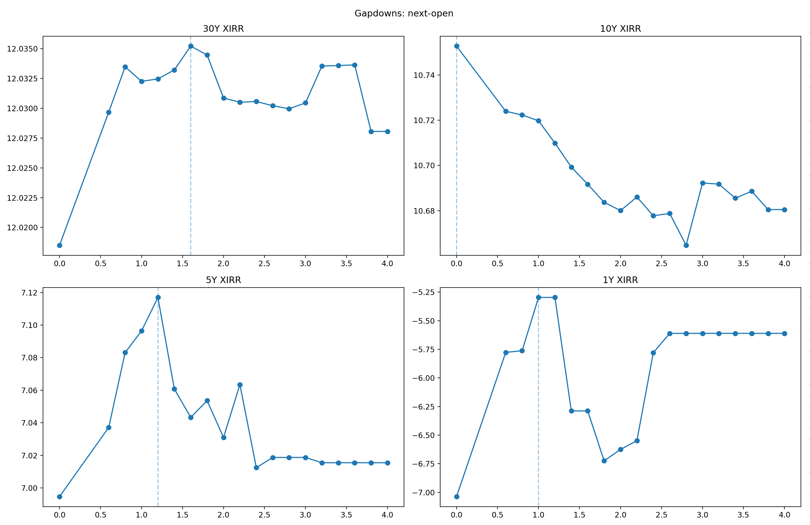
Dashboard: Overnight Gap-Down (Open variant) - Pure Signal, No Fallback
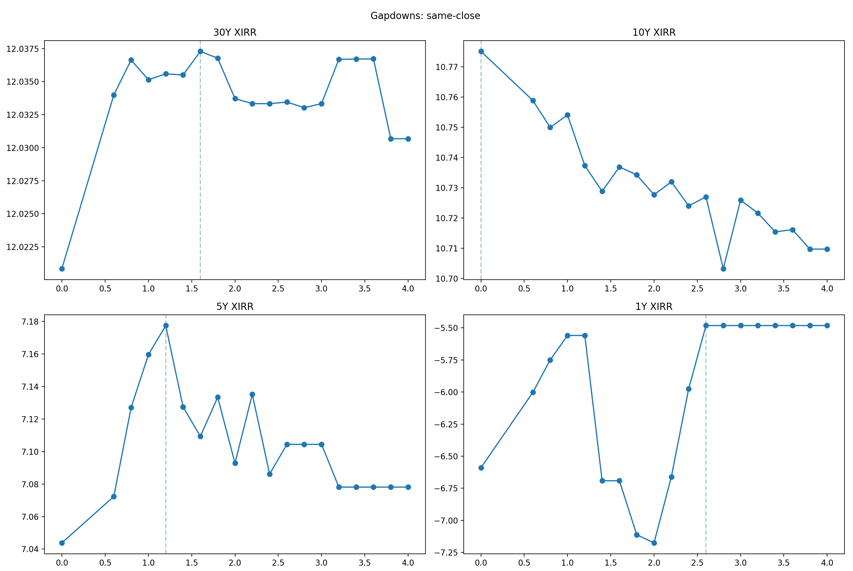
Dashboard: Overnight Gap-Down (Close variant) - Pure Signal, No Fallback
At 0% threshold (every day with a gap qualifies), the shortfall is modest: -₹1.28 lakh (CLOSE) and -₹1.42 lakh (OPEN). At 0.6%, it jumps to -₹4.95 lakh and -₹5.02 lakh. Then between 0.6% and 0.8%, something breaks completely.
At 0.8% threshold, XIRR drops from ~11.96% to ~11.19% in a single step. The wealth gap explodes to ₹48.2 lakh behind the SIP, worse than a decade's worth of contributions sitting in the wrong place. It keeps getting worse from there. At 1.0%: roughly ₹75 lakh behind. At 2.0%: ₹93 lakh behind. At 3.8% and 4.0%: both strategies produce identical results, XIRR of 8.65%, trailing the SIP by ₹1.51 crore. Four trades in 30 years. The outcome is determined entirely by when those four trades happened to land, not by any system.
The 0.8% cliff is the most telling data point in the entire dataset. Gap-downs of that magnitude on Nifty tend to be responses to real events: overnight geopolitical shocks, global sell-offs, emergency policy moves. Buying into those opens doesn't capture a discount. It captures the start of a drawdown. And since the signal fires on the same bar as execution, there is no buffer day, no lag, no chance for prices to stabilise. You're the first buyer into confirmed bad news.
Part 2: Signal Timing with Month-End Fallback
This version adds one rule: if no signal fires during a calendar month, the full bank balance deploys on the last trading day of that month. Cash never stays idle for more than a month.
Intraday Drawdowns with Fallback
Again, all 38 threshold combinations underperform the SIP. The fallback doesn't change the direction of the result.
Dashboard: Intraday Drawdown (Open variant) - With Month-End Fallback
Dashboard: Intraday Drawdown (Close variant) - With Month-End Fallback
What changes is the magnitude. At low thresholds, results are nearly identical to the no-fallback version because the signal fires often enough that there are few idle months anyway. But at higher thresholds, the fallback closes a lot of the gap.
At 4.0% threshold without fallback, the Drawdown Close strategy needed just 65 trades over 361 months, trailing the SIP by ₹3.83 lakh. With the fallback, it makes 360 trades (65 signal-triggered, 295 via fallback) and trails by only ₹1.28 lakh. The fallback handled 82% of the capital deployment. The "timing" element handled 18%.
At 2.0% threshold, the story is similar. Without fallback: 212 trades, -₹3.33 lakh. With fallback: 360 trades (148 via fallback), -₹1.86 lakh. Better, but still behind.
The improvement is real but it doesn't change the conclusion. At every threshold, the strategy with a fallback still underperforms the SIP. The fallback is essentially forcing the strategy to behave more like a SIP as thresholds rise, but each time it deploys capital at month-end rather than on the first trading day of the month, it introduces a small timing difference that the SIP doesn't bear.
Overnight Gap-Downs with Fallback
This is where the fallback produces the most dramatic transformation. The numbers change by an order of magnitude.
Dashboard: Overnight Gap-Down (Open variant) - With Month-End Fallback
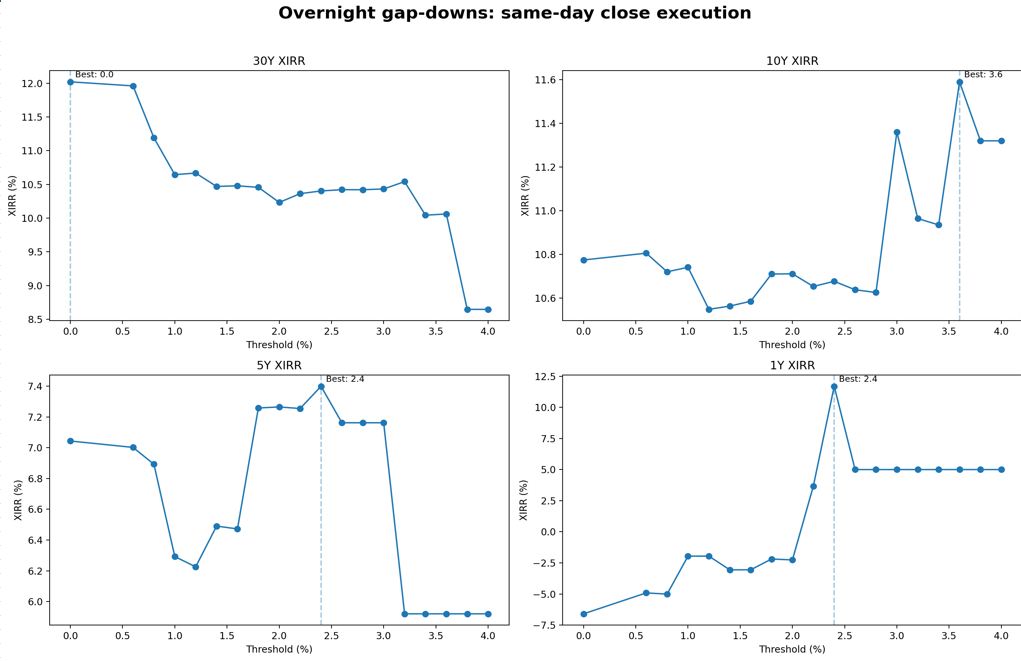
Dashboard: Overnight Gap-Down (Close variant) - With Month-End Fallback
At 0% threshold, results are identical to the no-fallback version because the signal fires on every gap day, so there are no idle months, and no fallback fires. At 0.6% threshold without fallback: -₹4.95 lakh (CLOSE). With fallback: -₹46,575. The fallback triggered in 213 of the 361 months, covering every month where no qualifying gap-down appeared.
At 0.8% threshold, the transformation is stark. Without fallback: -₹48.2 lakh (CLOSE). With fallback: -₹30,277. A 99.9% reduction in lost opportunity cost, achieved entirely by refusing to leave money idle. The signal fired in 104 months; the fallback covered the remaining 256.
By 4.0% threshold, the gap-down signal fired just 4 times in 30 years. The fallback handled the other 356 months. XIRR is 12.03% vs SIP's 12.04%, trailing by ₹67,028 (CLOSE) and ₹83,205 (OPEN). At this point, the strategy is 99% a SIP and 1% a gap-down timer. And the 1% makes it slightly worse.
This is the clearest data point in the second dataset: the fallback didn't make the gap-down strategy better than the SIP. It made it almost as good as the SIP by replacing almost all the timing decisions with SIP-equivalent buying. The strategy that looked like a clever timing system turned out, under scrutiny, to be a SIP with four extremely poor trades attached.
What the Fallback Actually Does
It's worth being direct about what the month-end fallback is and isn't.
It isn't an improvement to the strategy's signal. The fallback fires when the signal doesn't. It's a safety net for idle cash, not evidence that the timing idea works. At high thresholds, the fallback months wildly outnumber the signal months:
| Threshold | Gap-Down (Close) fallback months | Signal months | Trailing SIP by |
|---|---|---|---|
| 0.6% | 213 | 147 | ₹46,575 |
| 0.8% | 256 | 104 | ₹30,277 |
| 1.0% | 281 | 79 | ₹39,492 |
| 2.0% | 337 | 23 | ₹48,309 |
| 4.0% | 356 | 4 | ₹67,028 |
At 4%, the gap-down signal contributed 1.1% of total deployment decisions. Every number in that row that looks good compared to the version 1 gap-down results is explained by those 356 fallback months, not by the 4 signal months.
The fallback rescued the strategy from catastrophic underperformance by making it almost indistinguishable from a SIP. Which is, in itself, the finding.
The Numbers Side by Side
30-Year SIP baseline: XIRR 12.04%, final value ₹3.11 crore
| Strategy | Worst-Case Loss vs SIP | Without Fallback | With Fallback |
|---|---|---|---|
| Drawdown Close | ₹4.21 lakh | At 2.6% threshold | ₹2.48 lakh at 1.2% |
| Drawdown Open | ₹4.25 lakh | At 2.6% threshold | ₹2.42 lakh at 1.2% |
| Gapdown Close | ₹1.51 crore | At 3.8-4.0% threshold | ₹1.42 lakh at 0.0% |
| Gapdown Open | ₹1.51 crore | At 3.8-4.0% threshold | ₹1.42 lakh at 0.0% |
Without the fallback, the gap-down strategies at high thresholds represent a genuine catastrophe, more than four times the total capital contributed, lost in opportunity cost. The fallback compresses those losses to rounding errors. But it does so by replacing the timing strategy with a de facto SIP.
The Verdict
152 threshold combinations tested across four signal types and two deployment regimes. 152 underperformers over 30 years. Not a single one beat a simple monthly SIP.
The drawdown strategies fail because an intraday price fall carries no information about the next morning's price. The gap-down strategies fail harder in their pure form because large overnight gaps tend to precede continued weakness, not recovery. And the "fix", forcing deployment at month-end when no signal fires, works precisely by making the strategy less and less about timing.
The clearest takeaway from this entire exercise: the closer any of these strategies got to beating the SIP, the closer it was to being a SIP. At 4% threshold with a month-end fallback, the gap-down Close strategy trailed the SIP by ₹67,028 over 30 years on ₹36.1 lakh of contributions. That sounds almost acceptable, until you notice that 356 of the 361 monthly deployments came from the fallback, not the signal.
Nifty doesn't owe a bounce because it fell yesterday. The 30 years of data say so plainly.
Appendix: Assumptions and Methodology
Data and period: Nifty 50 daily OHLC data. 30-year primary test window (approximately 1994-2024), plus 20Y, 10Y, 5Y, and 1Y sub-periods.
SIP benchmark: ₹10,000 invested on the first trading day of every calendar month, at 0.03% transaction cost. No bank account. No signal logic. Returns measured as XIRR on the full cash-flow series.
Bank account: ₹10,000 credited on the first trading day of each month. Compounds at 5% per annum on actual calendar days (ACT/365). Balance accumulates until a signal triggers full deployment. No partial deployment; no fractional units.
Transaction cost: 0.03% applied to all buy transactions (signal-triggered and fallback). No STT, brokerage, or impact cost modelled beyond this flat charge.
Holding rule: All units purchased are held permanently. There is no sell logic, no rebalancing, and no stop-loss in any variant.
Signal definitions:
Drawdown (CLOSE variant): Signal fires when (Close[t-1] − Low[t]) / Close[t-1] ≥ threshold. Execution at next morning's Open[t+1], since the session low is only known after market close.
Drawdown (OPEN variant): Signal fires when (Open[t] − Low[t]) / Open[t] ≥ threshold. Same execution rule, next morning's Open[t+1].
Gap-Down (CLOSE variant): Signal fires when (Close[t-1] − Open[t]) / Close[t-1] ≥ threshold. Execution at the same Open[t] where the gap is measured.
Gap-Down (OPEN variant): Signal fires when (Close[t-1] − Open[t]) / Open[t] ≥ threshold. Execution at the same Open[t].
Thresholds tested: 0.0%, 0.2%, 0.4%, 0.6%, 0.8%, 1.0%, 1.2%, 1.4%, 1.6%, 1.8%, 2.0%, 2.2%, 2.4%, 2.6%, 2.8%, 3.0%, 3.2%, 3.4%, 3.6%, 3.8%, 4.0%, 19 levels per signal type per file.
Month-end fallback (Version 2 only): If no qualifying signal fires on or before the last trading day of a calendar month, the full bank balance is deployed at that day's closing price with the same 0.03% cost. This guarantees no capital sits idle past month-end.
Idle cash (Version 1): When no signal fires for multiple months, the bank balance compounds at 5% and is reported as "Idle Cash" at period end. High thresholds can produce significant idle balances, ₹2.41 lakh at 4% for drawdown strategies over 30 years.
Returns metric: XIRR computed on actual dates and cash flows for both strategy and SIP. MOIC (multiple on invested capital) and Sharpe ratio reported separately in dashboards.
What this test does not model: Taxes on capital gains, actual brokerage fees beyond 0.03%, slippage or market impact, dividend reinvestment (index used is price return), or any form of dynamic position sizing.
Attachments
Comments
Loading…
Sign in (top right) to comment.