The market, read carefully.
EOD breadth, backtested research and a live portfolio across the Nifty 100. Written slow. Updated every trading day.
Latest work
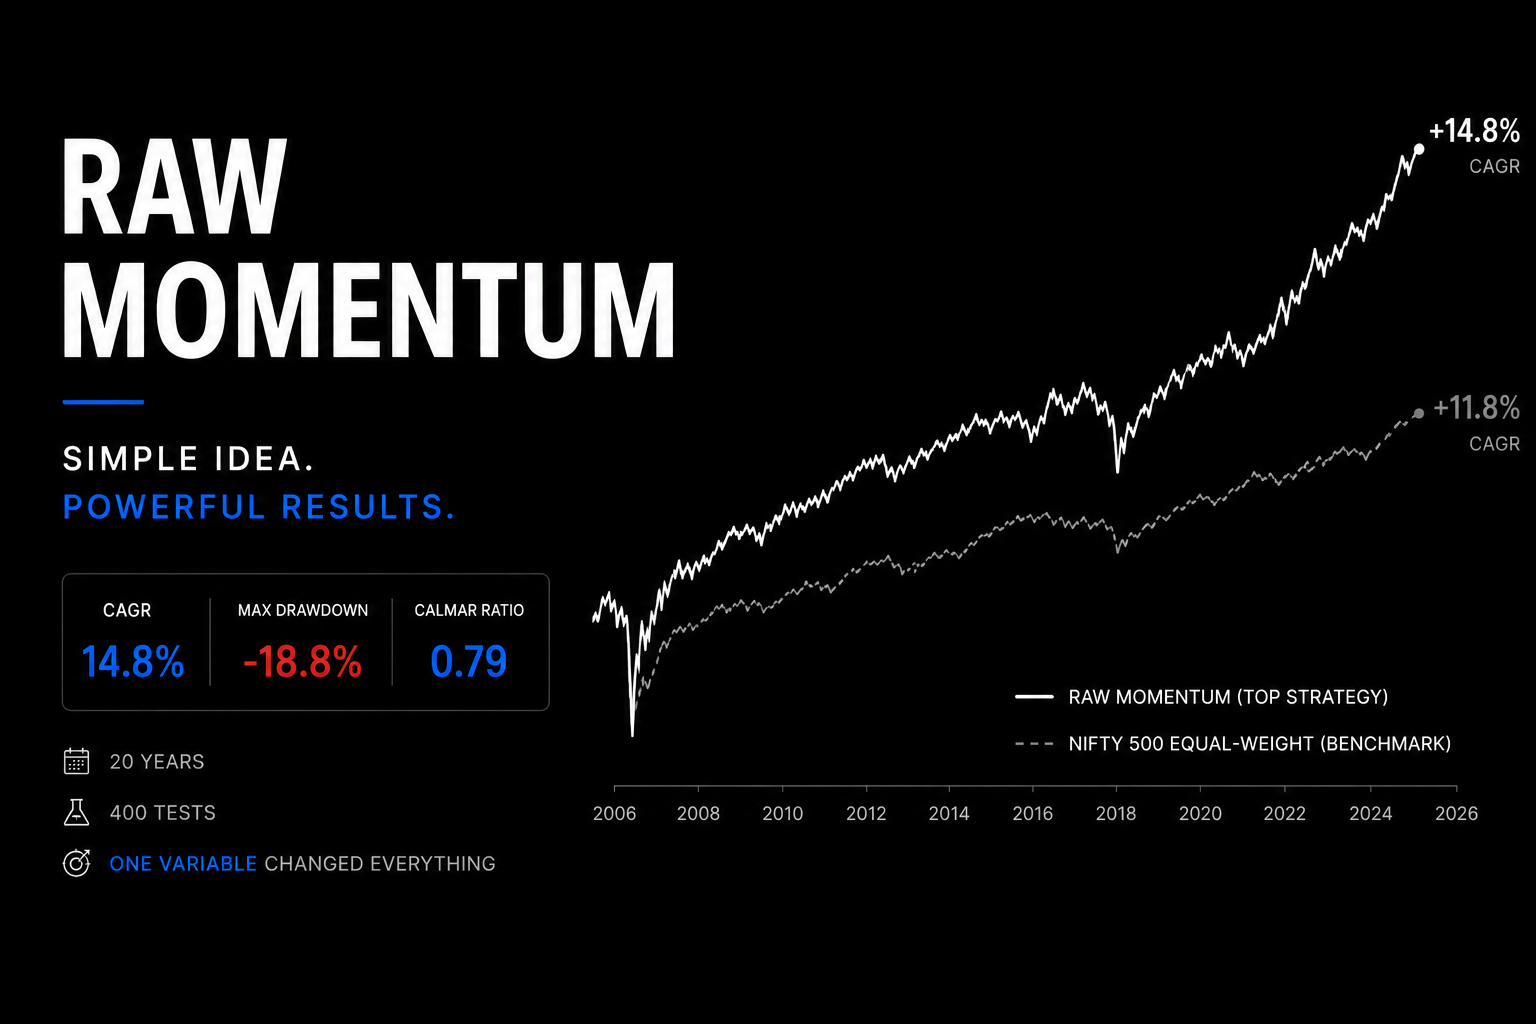
We Ran 400 Momentum Tests on Nifty 500 Stocks Across 20 Years. One Parameter Matters More Than Everything Else.
Raw price momentum was tested on the full Nifty 500 universe from 2006 to 2026. Four hundred combinations across portfolio size, lookback window, rebalancing frequency, and trailing stop-loss. The single variable that dominated every other was rebalancing frequency. Weekly rebalancing produced an average CAGR of -1.87% across 80 combinations. 12M rebalancing produced 12.44%. The signal is the same in both cases. The only thing that changes is how often you trade it.
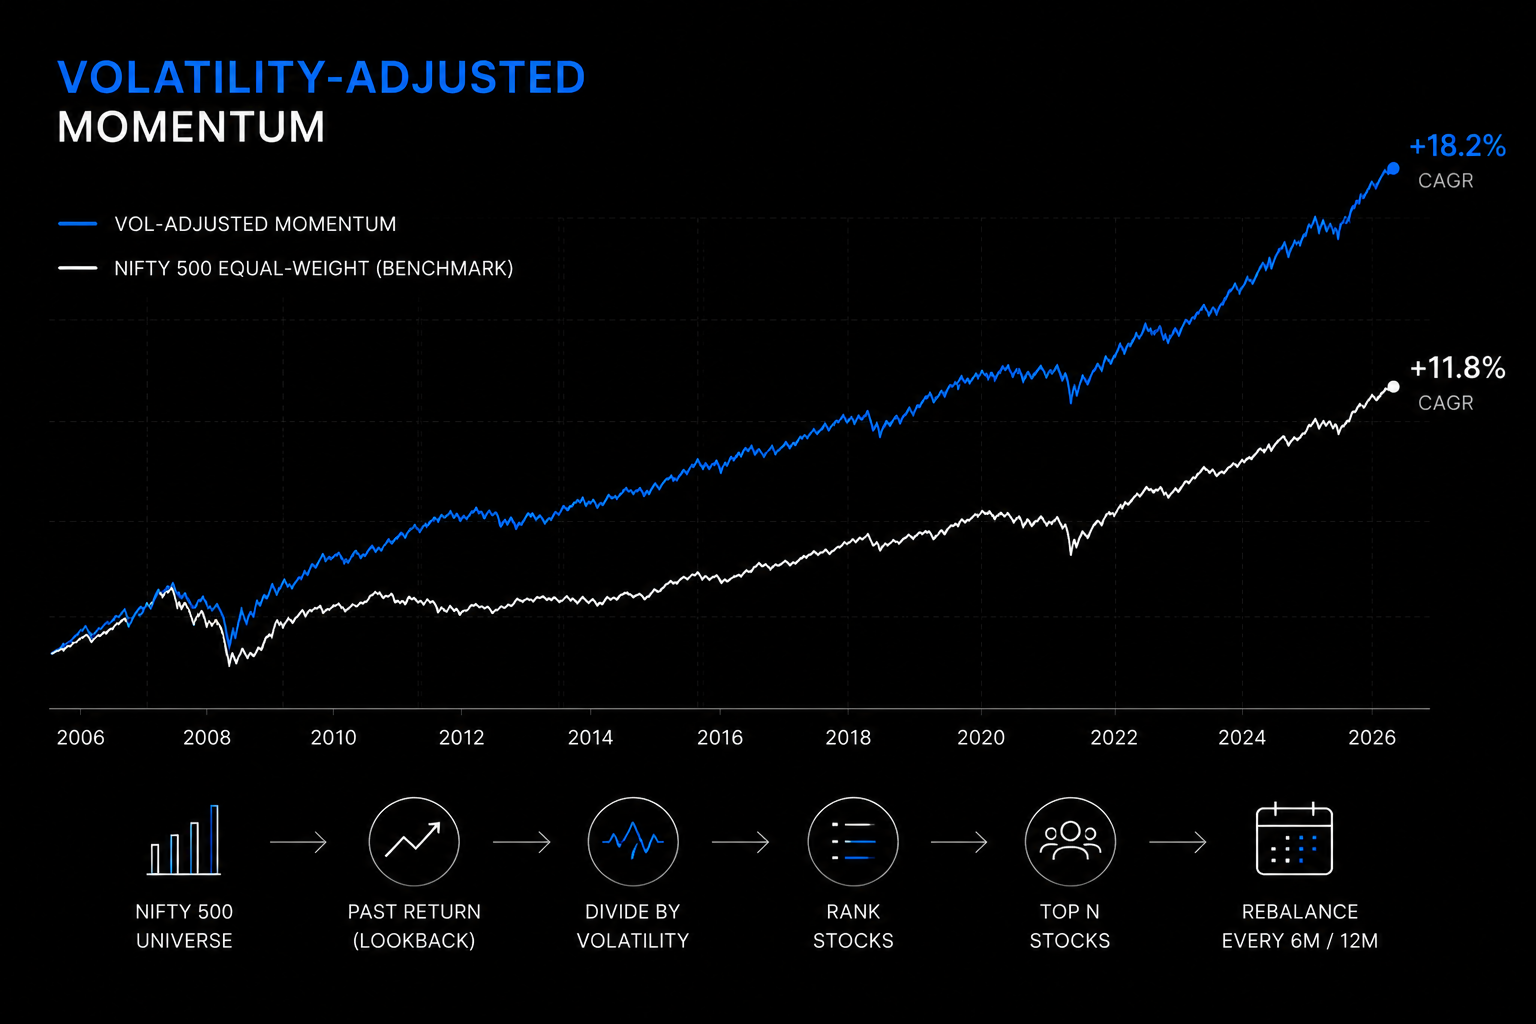
Dividing Momentum by Volatility Changes Everything Except the One Year It Cannot Fix.
After running 400 raw momentum combinations on the Nifty 500 universe, we tested a modified signal: instead of ranking stocks by past returns alone, we divided each stock's return by how volatile the journey was. A stock up 40% on a smooth trend ranks higher than one up 50% on wild swings. 240 combinations across 20 years of data. 227 of them beat the benchmark. The strategy that failed in 2009 still fails in 2009.

Buying Nifty After It Falls: 152 Tests Across 30 Years Show the Same Thing
Over 30 years of Nifty data, 152 backtests examined whether buying intraday dips or overnight gap-downs could outperform a simple SIP. Different thresholds, execution rules, and fallback mechanisms were tested and every variation underperformed the SIP benchmark.