Buying Nifty Strength: Intraday Breakouts and Overnight Gap-Ups vs the SIP
Four of 38 thresholds produce positive returns over the SIP across intraday breakout and overnight gap-up strategies. The best result adds ₹1.97 lakh over 30 years which is pretty much insignificant. The worst destroys ₹1.05 crore against SIP.

Both strategies find a narrow window where buying strength technically works. Neither finds one worth using.
The premise
The intuition here is the opposite of dip-buying. If Nifty is surging intraday or has already gapped up overnight, you are buying into confirmed positive price action rather than catching a falling knife. Momentum has academic support across asset classes. The question is whether that support translates to SIP enhancement on Nifty at daily resolution over 30 years of data.
How both strategies work
A bank account receives ₹10,000 on the first trading day of each month, compounding at 5% annualised on actual calendar days. When a signal fires, the full available balance deploys after a 0.03% transaction cost. All purchased units are held permanently with no selling or rebalancing. Both strategies test 19 thresholds from 0.0% to 4.0%. The benchmark is a capital-matched monthly SIP investing ₹10,000 on the first trading day of each month at 0.03% cost. SIP XIRR over the full test period: 11.9907%.
The signal logic differs by one day.
Overnight gap-up: (Open[t] − Close[t−1]) / Close[t−1] ≥ threshold. The signal is visible at the opening print, so execution happens at that same open.
Intraday breakout: (High − Open) / Open ≥ threshold. Because the session high is only knowable after the day ends, execution is at the next morning's open.
Overnight gap-ups: three thresholds outperform, narrowly
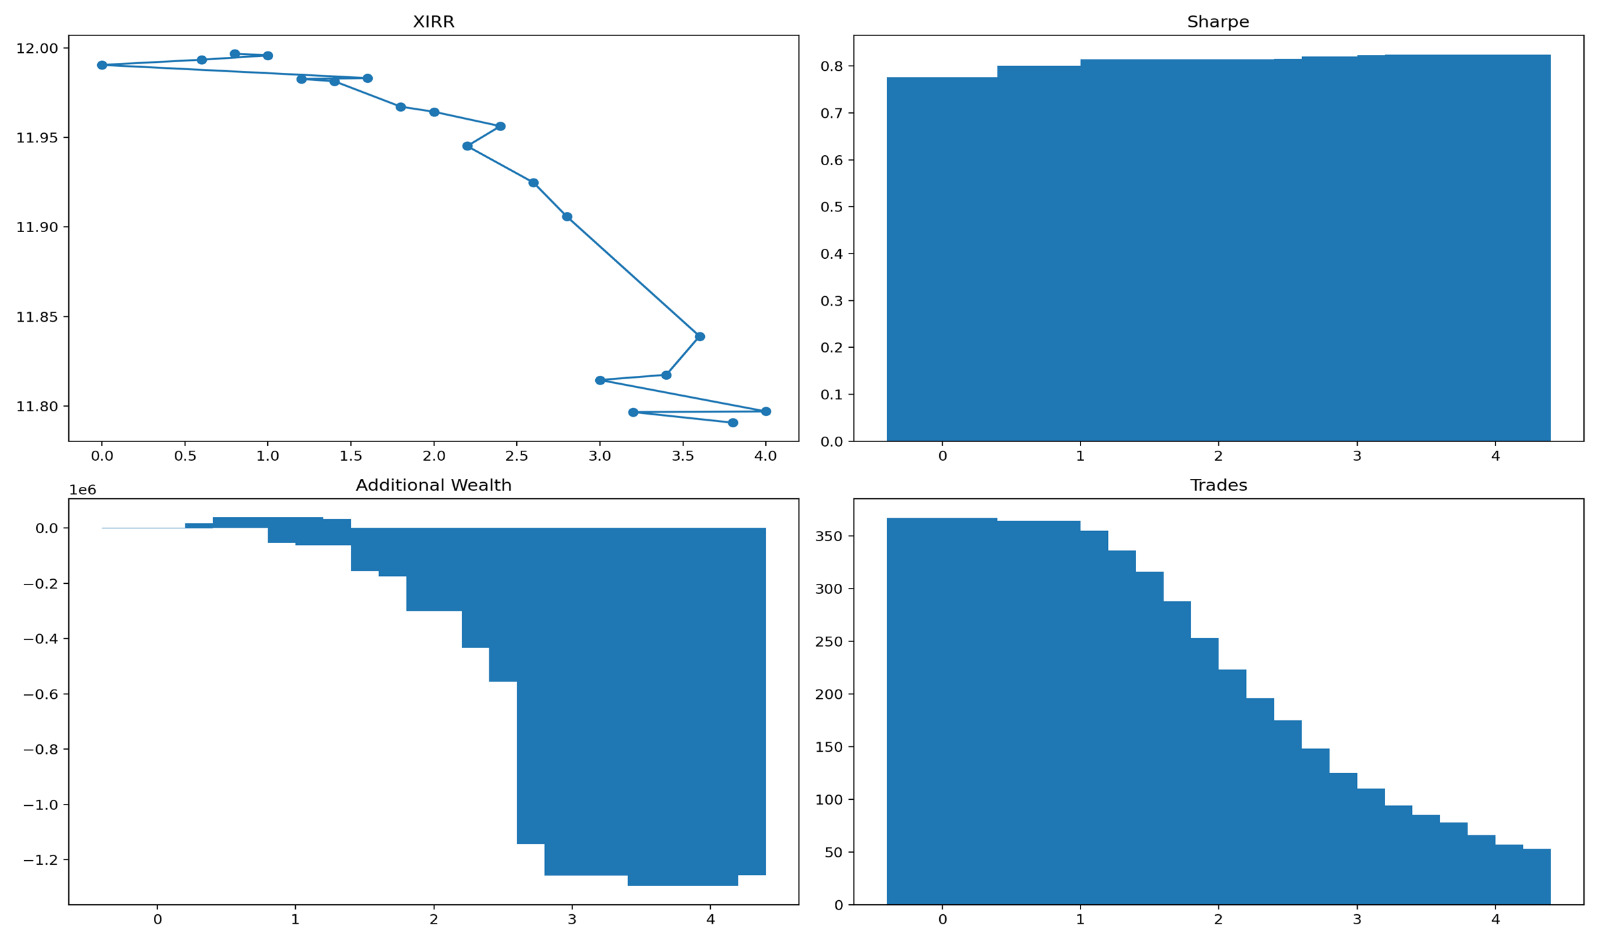
Unlike the weakness strategies, this one has green rows. At 0.6%, 0.8%, and 1.0%, the gap-up strategy outperforms SIP. The best threshold is 0.8%, producing XIRR of 11.9968% versus SIP's 11.9907%, an alpha of +0.006%, and additional wealth of ₹40,210 across 355 trades. At 1.0% the lead is ₹33,521. At 0.6%, ₹17,467.
These are real outperformances. They are also economically trivial. ₹40,210 on ₹36.7 lakh of contributions over 30 years is a rounding error. The MOIC difference is 8.9051x versus 8.8941x.
At 0% every gap qualifies as a signal and the strategy collapses to near-SIP behaviour, producing XIRR of 11.9905% and trailing by just ₹1,672. At 1.2% the edge reverses entirely. Alpha drops to -0.008% and the strategy trails by ₹53,473. That single step from 1.0% to 1.2% is the sharpest transition in the entire sweep.
Beyond 1.2%, deterioration is gradual until around 3.0%, where ₹7.17 lakh sits idle in bank earning 5% while Nifty compounds at 12%. The worst case is 3.8%, trailing SIP by ₹12.96 lakh.
Intraday breakouts: one threshold wins, then a cliff
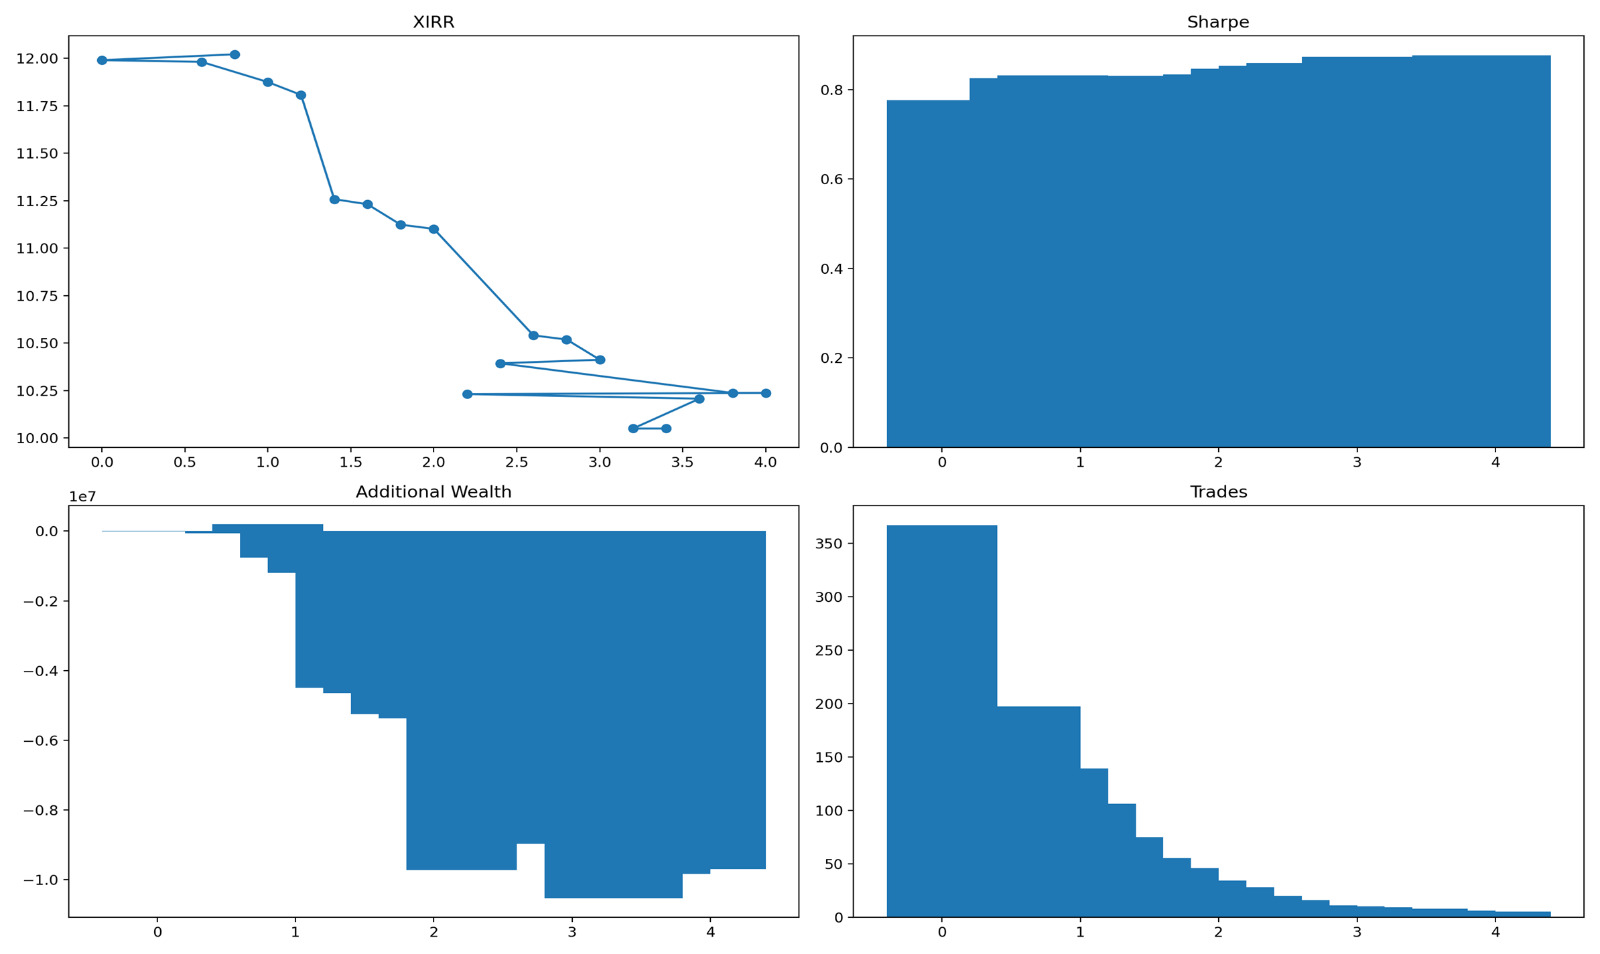
The intraday breakout strategy has exactly one outperforming threshold: 0.8%. It produces XIRR of 12.0204% versus 11.9907%, an alpha of +0.030%, and additional wealth of ₹1.97 lakh across 139 trades. This is the best single result across both strategies in this post and across all four daily-signal strategies tested so far. It still amounts to ₹1.97 lakh on ₹36.7 lakh over 30 years.
At 0.6% the strategy already underperforms by ₹65,168. At 0% it trails by ₹7,400. The 0.8% threshold is a narrow peak with steep drop-offs on both sides.
What follows at 1.4% is a genuine cliff. XIRR falls from 11.81% at 1.2% to 11.26% at 1.4%, a drop of 0.73 percentage points in a single threshold step. Additional wealth collapses from -₹11.95 lakh to -₹44.94 lakh. A 1.4% intraday surge on Nifty tends to occur on event-driven days, sharp bounces and post-announcement spikes, that are followed by mean reversion rather than continuation. Buying the next open captures the move after it has already happened.
A second deterioration appears between 2.0% and 2.2%, where the gap widens from -₹53.7 lakh to -₹97.2 lakh. From 3.0% upward, only 5 to 9 trades fire across the entire 30-year period. The worst cases at 3.2% and 3.4% produce identical results, XIRR of 10.05% and -₹1.05 crore versus SIP, because the trade dates are identical. At that point the backtest is not measuring a strategy. It is measuring the return from a handful of historically unusual days.
Reading both together
Thirty-eight thresholds tested. Four outperform: three in the gap-up strategy, one in the intraday breakout. That is a better scorecard than the two weakness strategies, which went 0 for 38. Buying into positive price action is marginally more effective than buying into negative price action on Nifty at daily resolution.
The gap-up advantage has a structural explanation. An overnight gap-up often reflects positive news that sustains into the session. The breakout edge at 0.8% reflects a threshold calibrated well enough to filter noise but not so extreme that it selects only event-driven moves that then reverse.
The absolute magnitude of the outperformance does not support acting on this finding. The best gap-up result adds ₹40k over three decades. The best breakout result adds ₹1.97 lakh. Against SIP's total gain of ₹2.9 crore on the same capital, these are sub-0.1% improvements. The downside of picking the wrong threshold is not symmetric. The intraday breakout's worst case destroys ₹1.05 crore against SIP. The gap-up's worst costs ₹12.96 lakh.
Verdict
Buying strength outperforms buying weakness on Nifty at daily resolution, but not in any economically meaningful way. Four of 38 thresholds produce positive alpha. The best result is ₹1.97 lakh of additional wealth over 30 years on ₹36.7 lakh of contributions. The worst trails SIP by ₹1.05 crore. No threshold delivers alpha worth the implementation complexity or the risk of getting the filter wrong. Daily price strength, like daily price weakness, does not improve on mechanical monthly investing.
Attachments
Comments
Loading…
Sign in (top right) to comment.