Buying Nifty Weakness: Intraday Dips and Overnight Gap-Downs vs the SIP
Both strategies lose. Across 30+ years of daily Nifty data and 19 thresholds each, buying intraday dips or overnight gap-downs never outperforms a monthly SIP. The worst interday gap-down variant, a 4% filter, trails the SIP by ₹1.47 crore on ₹36.7 lakh of contributions.

The premise
The intuition behind both strategies is identical: buy Nifty after it falls, get cheaper units, compound better over time. One measures intraday weakness, how far the price drops from the day's open to its low. The other measures overnight weakness, how far the opening price has fallen from the prior day's close. Different timeframes, same hypothesis. Across 30+ years of data, both reach the same answer.
How both strategies work
A bank account receives ₹10,000 on the first trading day of each month, compounding at 5% annualized on actual calendar days. When a signal fires, the full available balance deploys after a 0.03% transaction cost. All purchased units are held permanently with no selling or rebalancing. The signal logic is what differs. Intraday dip: (Open - Low) / Open >= threshold. Because the session low is only knowable after the day ends, execution is at the next morning's open. Overnight gap-down: (Close[t-1] - Open[t]) / Close[t-1] >= threshold. The signal is visible at the opening print itself, so execution is at that same open, same bar. Both test 19 thresholds from 0.0% to 4.0%. The benchmark throughout is a monthly SIP investing ₹10,000 on the first trading day of each month at 0.03% cost, no bank, no timing. SIP XIRR over the 30+ year test period: 11.99%. [INSERT IMAGE: Dashboard from the intraday dip backtest (Image 1 from the first upload, the four-chart panel with XIRR scatter, Sharpe, Additional Wealth, and Trades). Place here, after the mechanics.]
Intraday dips: 19 of 19 thresholds lose
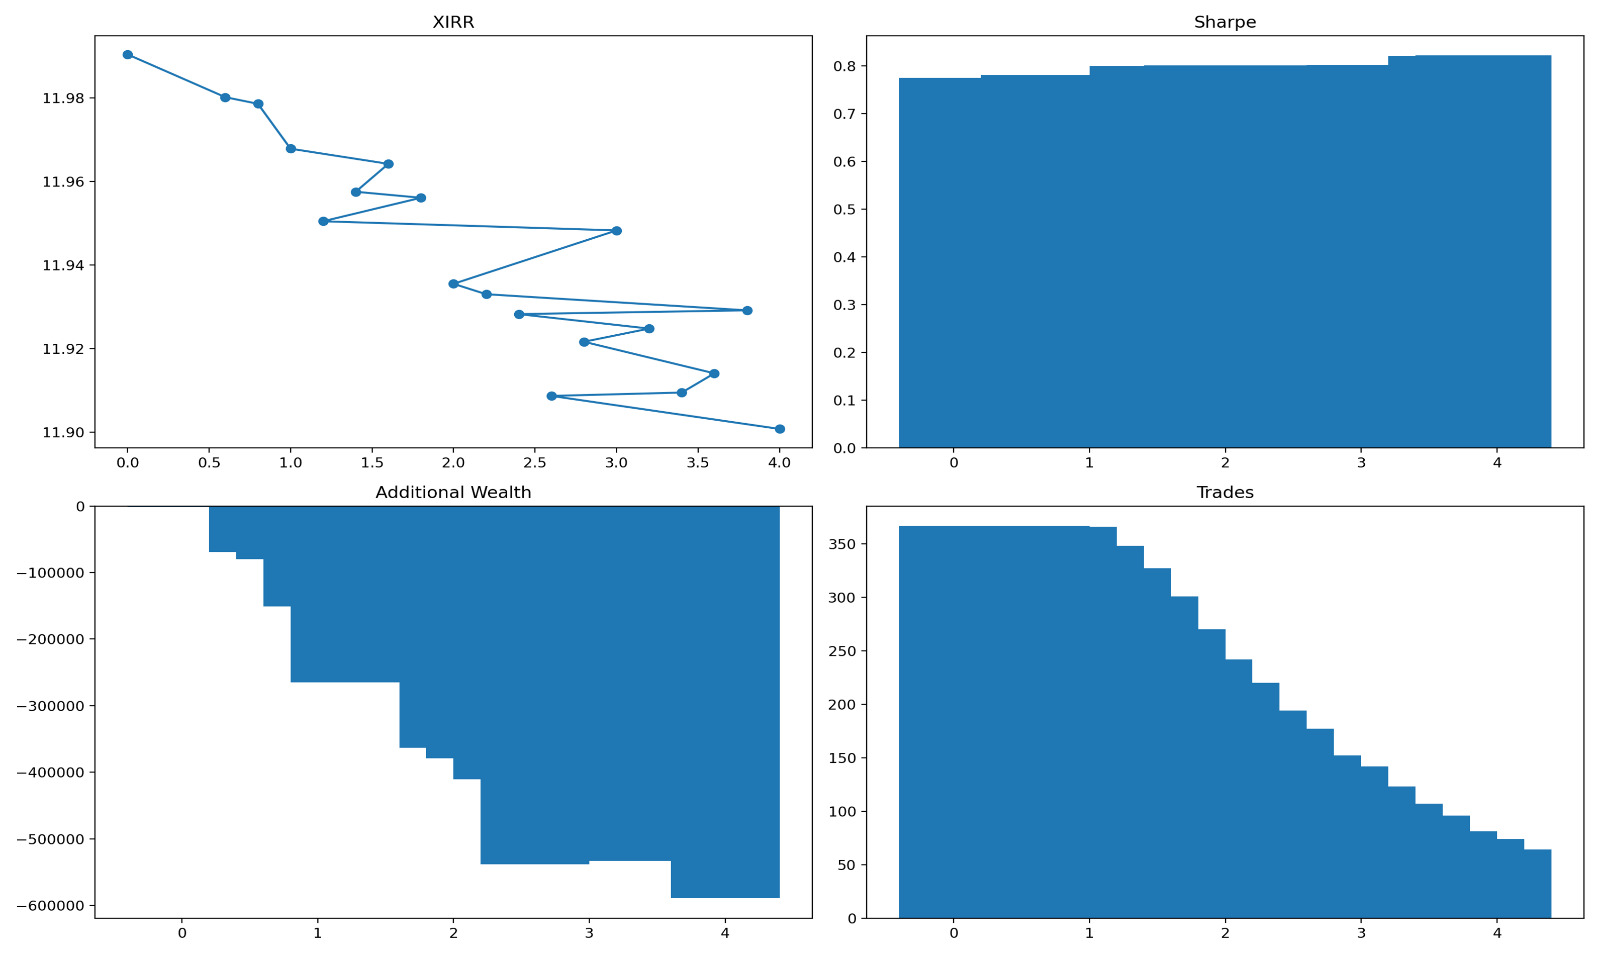
At 0% threshold, every trading day triggers a signal. But full bank deployment on the first daily signal collapses the strategy to roughly one trade per month, the same structure as the SIP. XIRR: 11.9905% vs 11.9907%. Final wealth gap: -₹1,672. As the threshold rises, that gap widens. At 1.0%, the strategy trails by ₹1.51 lakh. At 4.0%, it's -₹5.89 lakh, with ₹2.40 lakh sitting idle in bank at period end, having earned 5% while the market ran at 12%. Trade count falls from 367 at 0% to 64 at 4.0%. Sharpe improves from 0.776 to 0.823 because fewer trades produce a smoother return series. That doesn't help when the underlying return is deteriorating. MOIC drops from 8.89x to 8.73x over the same range. The reason it fails is structural. A large open-to-low drawdown during a session doesn't predict a favorable open the next morning. The next day's price is indifferent to how far the previous session fell.
Overnight gap-downs: the same result, but faster and worse
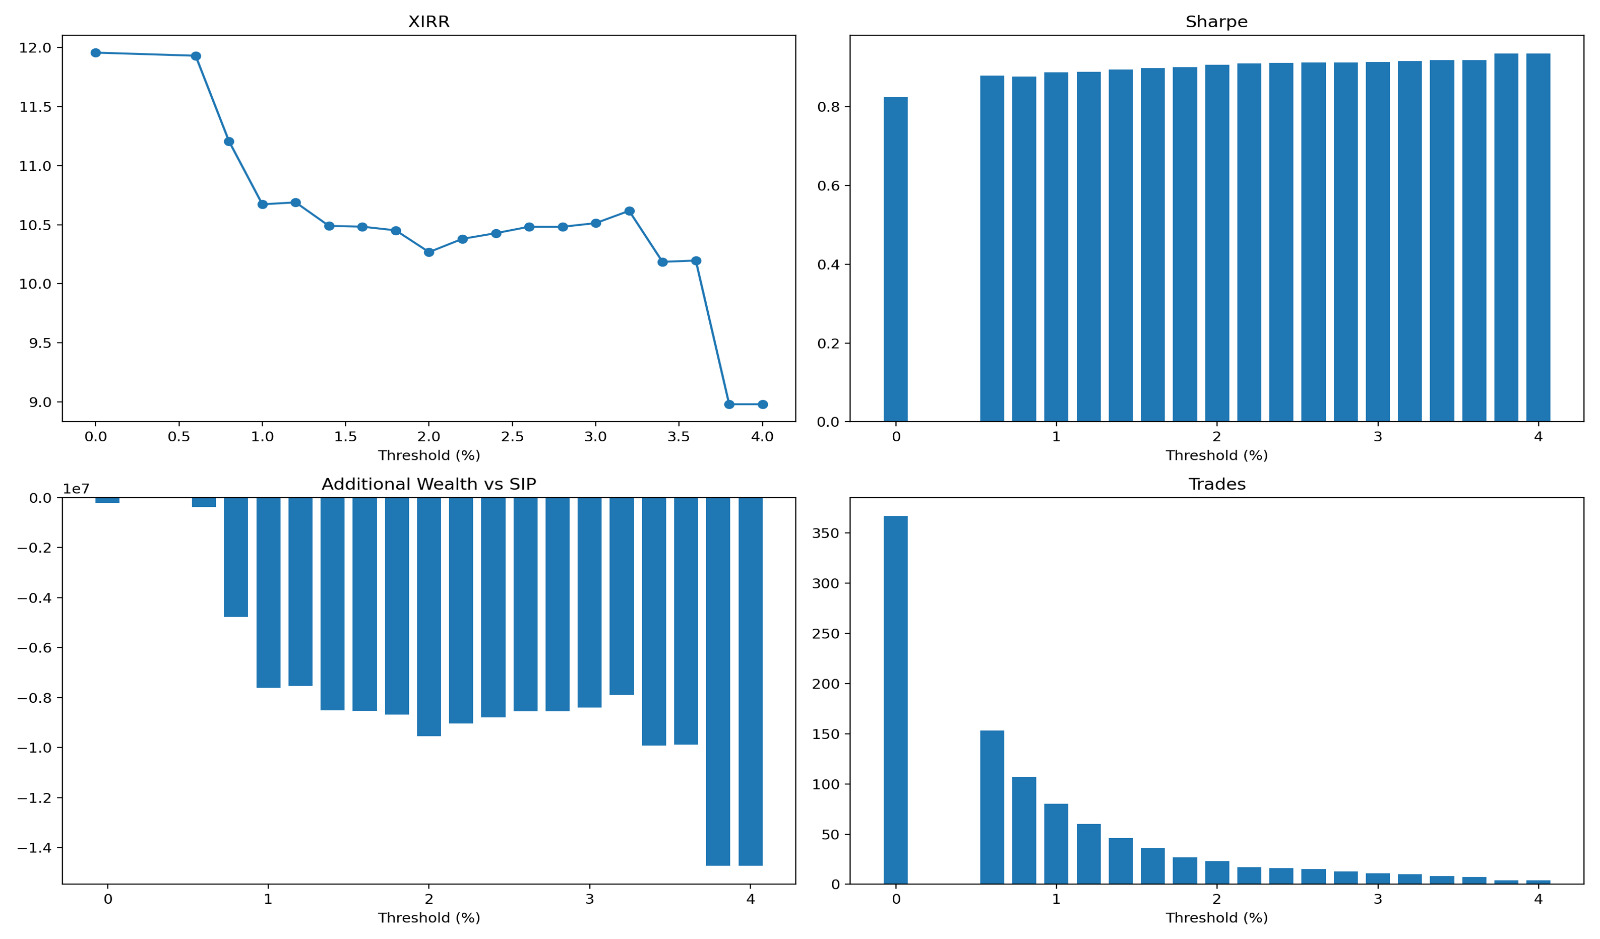 All 19 thresholds underperform. That's the same outcome as the intraday strategy. But the deterioration here is faster and far more severe.
At 0%, XIRR is 11.957% vs SIP's 11.991%, trailing by ₹2.21 lakh. At 0.6%, it's -₹3.91 lakh. Then between 0.6% and 0.8%, something breaks. XIRR drops from 11.93% to 11.21%, a fall of 0.72 percentage points across a single threshold step. The wealth gap jumps to -₹47.8 lakh.
From 0.8% onward, results don't recover. At 1.0% it's -₹76.1 lakh behind, at 2.0% it's -₹95.5 lakh, and at 3.8% and 4.0% XIRR reaches 8.98%, trailing the SIP by ₹1.47 crore. That's roughly four times the total capital contributed, lost in opportunity cost.
The cliff at 0.8% is the most instructive data point in this entire backtest. Gap-downs of that magnitude on Nifty tend to be responses to real overnight negative events: global selloffs, geopolitical developments, policy shocks. Buying at those opens doesn't capture a cheap entry. It captures the start of a drawdown. The same-bar execution that makes this strategy faster than the intraday version actually makes things worse here, because you're deploying capital into confirmed overnight weakness with no buffer day.
At 3.8% and 4.0% both thresholds produce identical results (8.978% XIRR, -₹1.47 crore), which tells you the signal is so rare that outcomes are determined by the specific dates of a handful of trades rather than any systematic edge.
All 19 thresholds underperform. That's the same outcome as the intraday strategy. But the deterioration here is faster and far more severe.
At 0%, XIRR is 11.957% vs SIP's 11.991%, trailing by ₹2.21 lakh. At 0.6%, it's -₹3.91 lakh. Then between 0.6% and 0.8%, something breaks. XIRR drops from 11.93% to 11.21%, a fall of 0.72 percentage points across a single threshold step. The wealth gap jumps to -₹47.8 lakh.
From 0.8% onward, results don't recover. At 1.0% it's -₹76.1 lakh behind, at 2.0% it's -₹95.5 lakh, and at 3.8% and 4.0% XIRR reaches 8.98%, trailing the SIP by ₹1.47 crore. That's roughly four times the total capital contributed, lost in opportunity cost.
The cliff at 0.8% is the most instructive data point in this entire backtest. Gap-downs of that magnitude on Nifty tend to be responses to real overnight negative events: global selloffs, geopolitical developments, policy shocks. Buying at those opens doesn't capture a cheap entry. It captures the start of a drawdown. The same-bar execution that makes this strategy faster than the intraday version actually makes things worse here, because you're deploying capital into confirmed overnight weakness with no buffer day.
At 3.8% and 4.0% both thresholds produce identical results (8.978% XIRR, -₹1.47 crore), which tells you the signal is so rare that outcomes are determined by the specific dates of a handful of trades rather than any systematic edge.
#Reading both together Thirty-eight thresholds tested across two strategies. Thirty-eight underperformers. The intraday dip strategy's worst case destroys ₹5.89 lakh vs SIP. The overnight gap-down strategy's worst case destroys ₹1.47 crore. Both measure the same underlying idea, and both fail. The gap-down version fails harder because the overnight signal carries more negative information than the intraday dip. A price that opens below the prior close has already moved against you before the trade is placed. In practice, what both backtests confirm is that daily price weakness doesn't predict recovery at the next bar. The market doesn't owe a bounce because it fell.
Verdict
The SIP wins all 19 tested thresholds for both strategies, over 30+ years of data. Buying intraday dips costs up to ₹5.89 lakh vs SIP. Buying overnight gap-downs costs up to ₹1.47 crore. In both cases, more selective entry criteria produce worse outcomes, not better ones. Timing Nifty on daily weakness, whether measured intraday or overnight, does not improve on mechanical monthly investing.
Attachments
- intraday-drawdown-strategy-results.xlsx (330 KB)
- interday-gapdown-strategy-results.xlsx (12706 KB)
Comments
Loading…
Sign in (top right) to comment.