Dividing Momentum by Volatility Changes Everything Except the One Year It Cannot Fix.
After running 400 raw momentum combinations on the Nifty 500 universe, we tested a modified signal: instead of ranking stocks by past returns alone, we divided each stock's return by how volatile the journey was. A stock up 40% on a smooth trend ranks higher than one up 50% on wild swings. 240 combinations across 20 years of data. 227 of them beat the benchmark. The strategy that failed in 2009 still fails in 2009.
**# What the Signal Is
Standard momentum ranks stocks by their total past return over N months. Every stock gets the same credit for the same return regardless of how it got there.
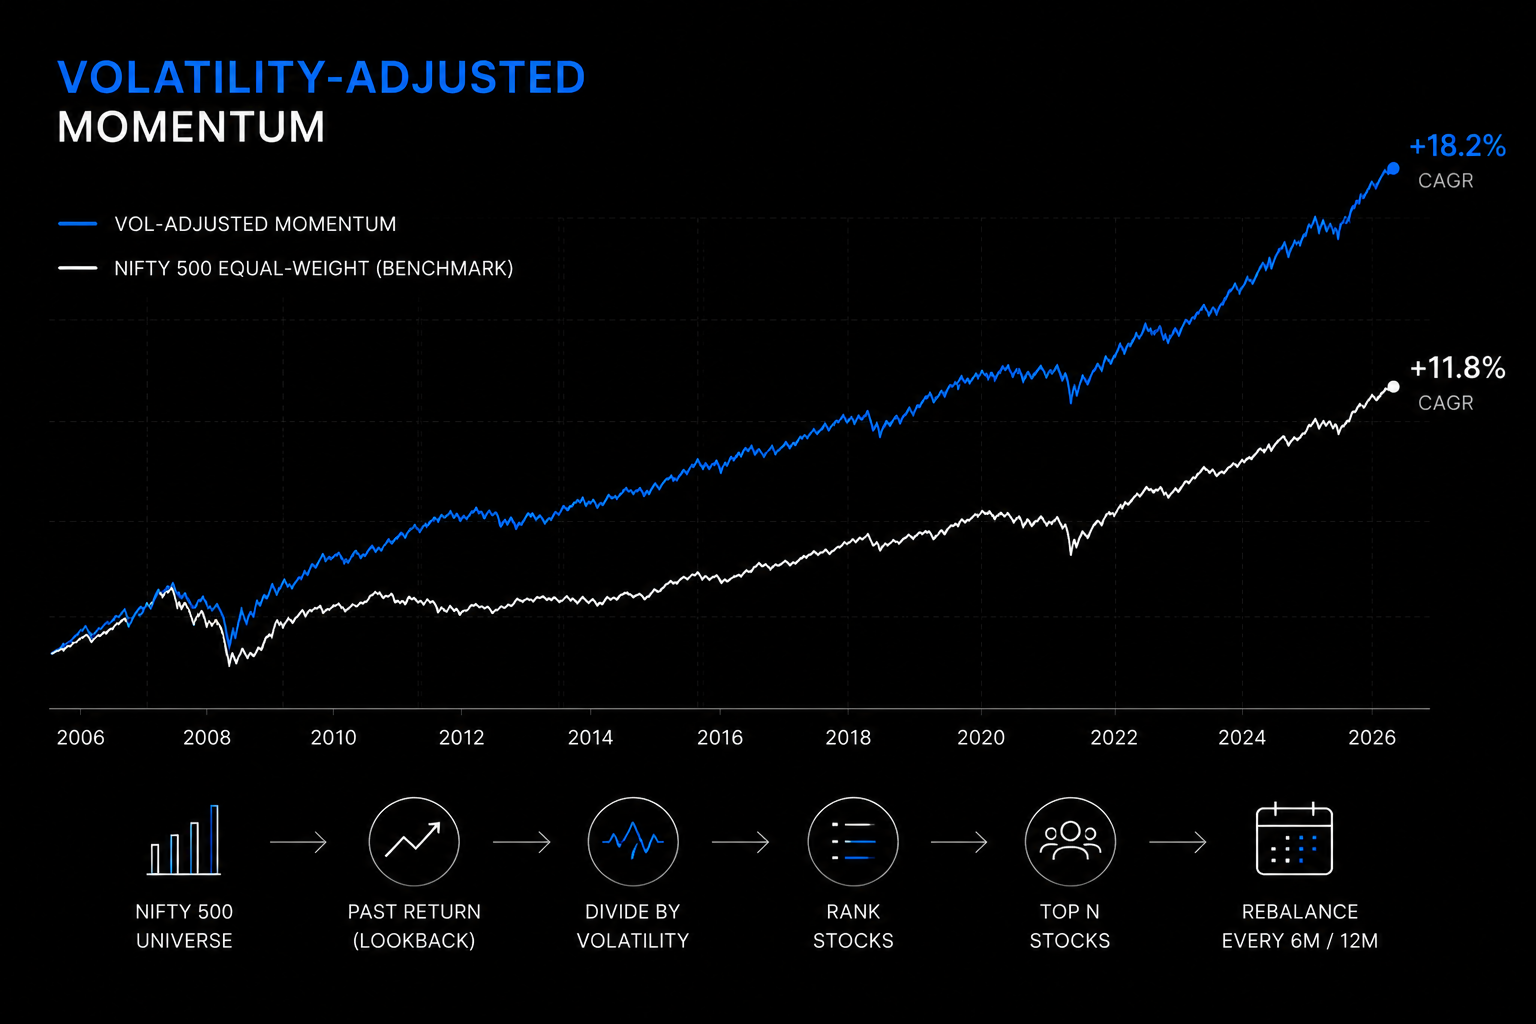
The volatility-adjusted signal adds one step: for each stock, divide its N-month return by its rolling annualised volatility over the past V trading days. Then rank cross-sectionally across all eligible stocks.
What this produces is, in effect, a stock-level Sharpe ratio of past performance. A stock up 35% with 15% annualised volatility scores 2.33. A stock up 50% with 40% annualised volatility scores 1.25. The second stock had a better raw return but a worse risk-adjusted one. Under this signal, the first stock ranks higher.
The practical effect is that the portfolio tilts away from high-beta, high-variance stocks that happened to move a lot in the lookback window and toward stocks with more consistent, smoother trends. In calm bull markets this makes little difference. In volatile or choppy markets it makes a large one.
The Setup
This test builds directly on the raw momentum findings. Weekly and monthly rebalancing were excluded entirely because the prior test showed they destroy returns through transaction costs, leaving nothing worth testing regardless of signal quality. Only 6M and 12M rebalancing were tested here.
Stocks: Nifty 500 universe, same eligible universe mask and data as the raw momentum test. March 2006 to May 2026.
Transaction cost: 0.03% per side. Capital gains tax: 10% on realised profits. Execution: same signal-at-close, entry-at-next-open logic with intraday trailing stop tracking.
Grid:
- Portfolio sizes: 10, 20, 30, 40, 50 stocks
- Lookback windows: 3M, 6M, 9M, 12M
- Vol estimation windows: 1M (21 trading days), 3M (63 trading days)
- Rebalancing frequencies: 6M, 12M
- Trailing stop-loss: none, 20%, 25%
Total combinations: 240
Benchmark: Nifty 500 equal-weight index. CAGR 11.8%, max drawdown -70.3%, Calmar 0.167.
How It Compares to Raw Momentum
The most direct comparison is at the same rebalancing frequency and stop-loss level. Both columns below filter to 12M rebalancing with 20% or 25% trailing stop-loss only, matching the parameter range shared by both grids. The raw momentum average across all 80 combinations at 12M rebalancing (including no stop-loss and 15% stop) was 12.44%, so the 14.23% here is a filtered subset, not the overall average.
| Signal | Avg CAGR | Avg Calmar |
|---|---|---|
| Raw momentum (12M rebal, 20/25% SL) | 14.23% | 0.555 |
| Vol-adjusted momentum (12M rebal, 20/25% SL) | 15.12% | 0.626 |
Roughly 0.9 percentage points more CAGR and 0.07 more Calmar in the same parameter zone. Consistent, not dramatic.
The broader picture is more striking. Of 240 vol-adjusted combinations, 227 beat the benchmark CAGR of 11.8%. In the raw momentum test, 130 of 400 combinations did, but that number was pulled down significantly by weekly rebalancing and monthly rebalancing failures. Filtering to the same frequency range that vol-adjusted uses, the comparison is closer but vol-adjusted still comes out ahead on average.
Average CAGR across all 240 vol-adjusted combinations: 14.37%. Average Calmar: 0.406. In the raw momentum grid, filtering to 6M and 12M rebalancing only, average CAGR is 12.74% and average Calmar is 0.404. The CAGR advantage is 1.6 percentage points. The Calmar is roughly equal at the average level but the vol-adjusted version produces better top results.
The Two Vol Windows
The 1M vol window (21 trading days) estimates volatility on the most recent month of daily returns. It responds quickly to spikes in volatility, which means a stock that has recently become erratic gets penalised fast. The 3M vol window is slower: it averages volatility over the past three months, making it less reactive to short-term bursts.
In practice the two perform nearly identically on average:
| Vol Window | Avg CAGR | Avg Calmar |
|---|---|---|
| 1M-vol (21d) | 14.25% | 0.404 |
| 3M-vol (63d) | 14.48% | 0.408 |
The 3M-vol window has a slightly higher average because it is smoother and produces fewer signal changes around volatile episodes. But the top combinations by Calmar are mostly 1M-vol, because in the most important crash years (2008, 2011, 2018), the 1M window picks up volatility spikes faster and rotates out of the damaged stocks sooner.
Where the Improvement Comes From
The year-by-year comparison between raw and vol-adjusted shows exactly when the signal change matters. All 21 years are shown. The negative difference rows are as important as the positive ones.
| Year | Benchmark | Raw: % Beating BM | VA: % Beating BM | Difference |
|---|---|---|---|---|
| 2006 | +5.6% | 36% | 20% | -16% |
| 2007 | +65.8% | 54% | 32% | -21% |
| 2008 | -61.9% | 55% | 90% | +35% |
| 2009 | +138.8% | 0% | 0% | 0% |
| 2010 | +19.6% | 12% | 15% | +3% |
| 2011 | -35.7% | 100% | 100% | 0% |
| 2012 | +37.1% | 20% | 28% | +8% |
| 2013 | -9.3% | 64% | 98% | +34% |
| 2014 | +59.1% | 29% | 67% | +38% |
| 2015 | +5.5% | 31% | 48% | +17% |
| 2016 | +2.0% | 8% | 31% | +23% |
| 2017 | +49.1% | 60% | 59% | -1% |
| 2018 | -21.8% | 56% | 84% | +28% |
| 2019 | -8.5% | 83% | 100% | +17% |
| 2020 | +24.7% | 66% | 88% | +22% |
| 2021 | +47.8% | 25% | 14% | -11% |
| 2022 | +0.7% | 10% | 12% | +2% |
| 2023 | +40.2% | 65% | 72% | +7% |
| 2024 | +21.8% | 34% | 63% | +30% |
| 2025 | -0.3% | 16% | 54% | +37% |
| 2026 | +2.5% | 51% | 33% | -18% |
Vol-adjusted loses ground in four years: 2006, 2007, 2021, and 2026. Three of those are strong bull-run years where high-beta stocks dominate returns and the volatility filter actively penalises them. 2021 is the worst of the four, and it is worth looking at directly.
In 2008, the benchmark fell 61.9%. Raw momentum had a 55% win rate, which is decent. Vol-adjusted had a 90% win rate. The reason is that in the months leading into the crash, the stocks with the highest raw returns had also been among the most volatile. By ranking on return/volatility instead of return alone, the vol-adjusted signal had already rotated away from many of those high-beta names before the crash hit. When the stop-loss then fired, it was triggering on stocks that had lower peak prices to begin with, meaning smaller absolute drawdowns.
2025 is the other notable year. The benchmark barely moved (-0.26%), but individual stock volatility was high and dispersed. Raw momentum win rate was 16%. Vol-adjusted win rate was 54%. In choppy flat markets, the ability to distinguish between stocks that moved a lot and stocks that moved consistently matters more than in trending markets.
2013 (benchmark -9.3%, a sideways down year) produced a 98% vol-adjusted win rate against 64% for raw. Again, a correction year where the volatility filter helps identify which stocks are declining on volume and conviction versus which are declining on noise.
The Same Failure Mode
The 2009 crash recovery failure is identical across both strategies.
In 2009, the benchmark rallied 138.8% off its March lows. Zero of the 240 vol-adjusted combinations beat the benchmark. Zero of the 400 raw combinations beat it either. The problem is not the volatility adjustment. It is the structure of momentum itself.
After a crash, the best past-return stocks (which momentum holds) are not the ones that recover fastest. The stocks that fell 80 to 90% from peak tend to bounce hardest in the recovery. Momentum systematically holds the prior cycle's winners and avoids the prior cycle's losers. Adjusting for volatility does not change this because the recovery stocks had high volatility on the way down and high volatility on the way up. A vol-adjusted signal does not suddenly prefer them.
2021 is the one year in this dataset where vol-adjustment makes things worse, not better. The benchmark gained 47.8% and vol-adjusted momentum beat it in only 14% of combinations, against raw momentum's 25%. The volatility filter is the direct cause. In 2021, many of the highest-returning stocks were also high-beta names with elevated volatility. The vol-adjusted signal ranked them lower precisely because of that volatility, so the portfolio held smoother but slower-moving stocks while the benchmark was being lifted by the names the signal had excluded.
The regime failure is predictable and consistent. Momentum, with or without volatility adjustment, underperforms in V-shaped post-crash recoveries and low-dispersion bull runs. It outperforms in correction years and directionally trending markets. 20 years of data show that this tradeoff resolves positively over a full cycle, but you have to accept the failure years as part of the system.
The Best Combinations
Best by CAGR: 10 stocks, 6M lookback, 1M vol window, 12M rebalancing, 25% trailing stop. CAGR 18.72%, max drawdown -34.60%, Calmar 0.541.
This is the highest returning combination in either strategy test. But the concentrated 10-stock portfolio and the 25% stop are doing a lot of the work. The high CAGR comes from a small number of exceptional stock picks in exceptional years. The max drawdown of 34.6% is substantially higher than the best Calmar combinations. For a live implementation this would require a high tolerance for interim loss.
Best by Calmar: 50 stocks, 6M lookback, 1M vol window, 12M rebalancing, 20% trailing stop. CAGR 15.21%, max drawdown -18.36%, Calmar 0.829.
This is the best risk-adjusted result across both strategy tests combined. For comparison, the best raw momentum Calmar was 0.787. The vol-adjusted version improves Calmar by 0.042 while also reducing maximum drawdown from 18.76% to 18.36%.
The performance in specific hard years for this combination:
| Year | Benchmark | This Strategy |
|---|---|---|
| 2008 | -61.9% | -13.7% |
| 2011 | -35.7% | -7.3% |
| 2018 | -21.8% | -8.2% |
| 2019 | -8.5% | -3.3% |
Four of the five worst years for the benchmark across 20 years. This combination lost between 3.3% and 13.7% in each of them. The portfolio construction (50 stocks, 12M rebalancing, 20% stop) is doing most of the work, but the vol-adjusted signal is contributing by systematically excluding stocks whose high past returns were built on high volatility.
The cluster that consistently produces good results: 30 to 50 stocks, 6M lookback, 1M or 3M vol window, 12M rebalancing, 20% trailing stop. CAGR range in this cluster is 14 to 16%, max drawdown 17 to 22%, Calmar 0.7 to 0.83.
The Verdict
Dividing momentum by volatility makes momentum better. Not dramatically, but consistently. The improvement shows up most clearly in the years where it matters most: correction years and high-volatility years. It does not help in crash recoveries, which is not a failure of the adjustment but a structural feature of any momentum-based approach.
227 of 240 combinations beat the benchmark after costs and tax over 20 years. The average CAGR across the full grid is 14.37% versus the benchmark's 11.8%. The best Calmar combination produces 15.21% CAGR with an 18.36% maximum drawdown, against the benchmark's 11.8% CAGR and 70.3% drawdown.
The two parameters that drive most of the outcome are the same ones that drove raw momentum: rebalancing frequency (6M or 12M) and trailing stop-loss (20%). The vol window and lookback are secondary. The volatility adjustment is a signal-level improvement that works on top of the right structural choices. It does not rescue a badly structured setup.
There is one year, 2009, where all 240 combinations underperformed a 138.8% benchmark rally. This is not fixable within the momentum framework. It is the cost of the approach. Over 20 years, the other 20 years more than compensate for it. That is the honest version of the result.
Appendix: Assumptions and Methodology
Data and period: Nifty 500 universe, daily OHLC data. March 2006 to May 2026, approximately 4,983 trading days, up to 1,291 stocks in the universe.
Benchmark: Nifty 500 equal-weight index. CAGR 11.8%, max drawdown -70.3%, Calmar 0.167.
Signal: For each stock, its N-month raw return divided by its annualised rolling standard deviation of daily returns over the prior V trading days. Minimum observation requirement for the vol window: half the window length. Stocks below the minimum are excluded at that date. Cross-sectionally percentile-ranked to [0, 1]. Top N stocks selected.
Vol windows: 21 trading days (1M-vol) and 63 trading days (3M-vol). Annualised by multiplying standard deviation by the square root of 252.
Execution: Signal observed at day T close. Entry at day T+1 open. Trailing stop-loss tracked from entry peak price. Gap-stop exits at open if already below stop. Intraday-stop exits at close if crossed during session.
Transaction cost: 0.03% per side on all buy and sell transactions.
Capital gains tax: 10% on realised profits at each sell event. Loss positions pay no tax. Cost basis tracked per position.
Rebalancing frequencies tested: 6M and 12M only. Weekly and monthly excluded based on prior raw momentum findings showing transaction cost destruction at those frequencies.
Stop-loss levels: None, 20%, 25% trailing. 15% excluded based on prior raw momentum findings showing adverse whipsaw behaviour.
Returns metric: CAGR from full equity curve. XIRR from actual cash-flow dates. Maximum drawdown is the largest peak-to-trough decline in the equity curve. Calmar is CAGR divided by absolute maximum drawdown.
What this does not model: Brokerage beyond 0.03%, STT, stamp duty, market impact or slippage, dividend reinvestment. The eligible universe mask does not fully replicate survivorship bias conditions of a live portfolio.**
Attachments
- Volume adjusted all results.csv (40 KB)
- volume adjusted top 20.xlsx (16 KB)
Comments
Loading…
Sign in (top right) to comment.