We Ran 400 Momentum Tests on Nifty 500 Stocks Across 20 Years. One Parameter Matters More Than Everything Else.
Raw price momentum was tested on the full Nifty 500 universe from 2006 to 2026. Four hundred combinations across portfolio size, lookback window, rebalancing frequency, and trailing stop-loss. The single variable that dominated every other was rebalancing frequency. Weekly rebalancing produced an average CAGR of -1.87% across 80 combinations. 12M rebalancing produced 12.44%. The signal is the same in both cases. The only thing that changes is how often you trade it.
**# What We Were Testing
The hypothesis behind every combination here is the same: stocks that have gone up over the past several months tend to keep going up relative to stocks that have not. You buy the top performers, hold them, rotate at fixed intervals, and the cross-sectional spread in returns does the work.
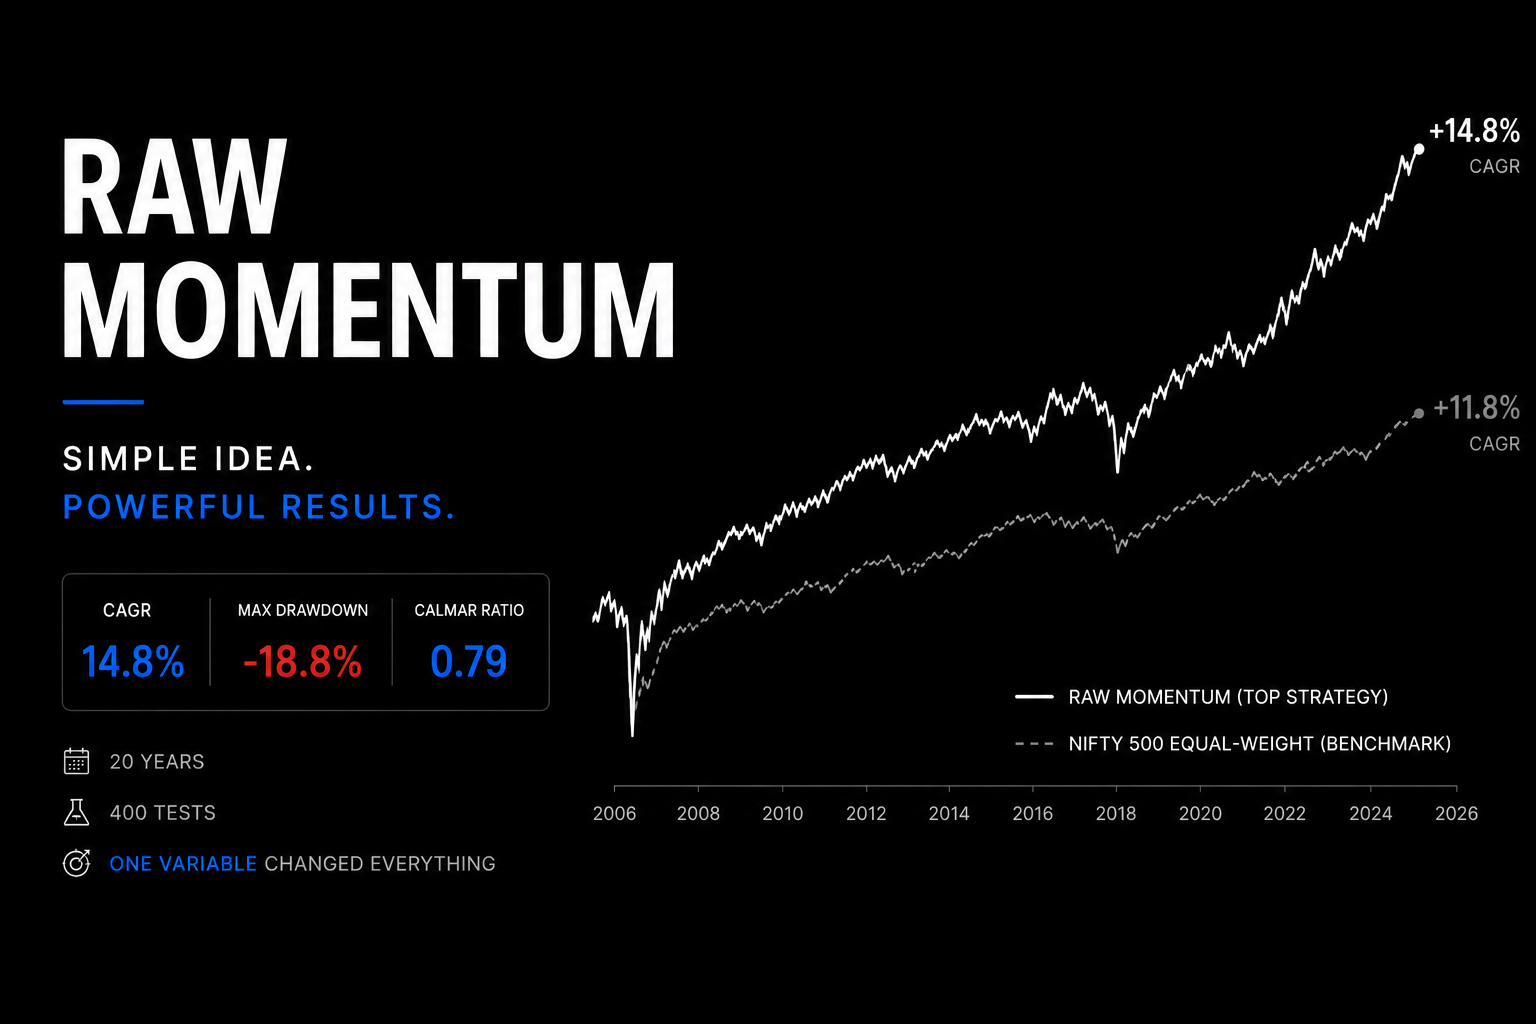
The benchmark is the Nifty 500 equal-weight index. From March 2006 to May 2026, it produced 11.8% CAGR with a maximum drawdown of 70.3% during the 2008 crash. Calmar ratio of 0.167. Everything is measured against this.
The signal is raw price momentum: the total return of each stock over a lookback window of 3, 6, 9, or 12 months, ranked cross-sectionally across all eligible stocks. The top N stocks by rank are bought at the next open. No fundamental filters, no quality screens, no adjustments for volatility. Just price.
The Setup
Stocks: The Nifty 500 historical universe. This is not just the current 500 constituents but all stocks that have ever been part of the index across the 20-year period, because the index composition changes through additions and deletions over time. The total number of distinct stocks in the dataset reaches 1,291. At any single date, the eligible universe is the actual index membership at that point, so a stock is only available for selection during the period it was in the index. The precomputed eligibility mask enforces this date-by-date.
Transaction cost: 0.03% per side on every buy and sell.
Tax: 10% capital gains tax applied to realised profits at every exit, whether from a scheduled rebalance or a stop-loss. Loss positions pay no tax. Cost basis tracked per position.
Execution: Rebalance signal observed at end of day T, position entered at open of day T+1. Trailing stop-loss checked intraday: if the stock gaps below the stop at open, it exits at the open price. If it crosses intraday, it exits at close.
Grid:
- Portfolio sizes: 10, 20, 30, 40, 50 stocks
- Lookback windows: 3M (63 days), 6M (126 days), 9M (189 days), 12M (252 days)
- Rebalancing frequencies: weekly, monthly, 3M, 6M, 12M
- Trailing stop-loss: none, 15%, 20%, 25%
Total combinations: 400
What Rebalancing Frequency Does to Returns
No other parameter comes close to rebalancing frequency in terms of its effect on outcomes. The direction is stark and consistent across all 80 combinations at each frequency level.
| Rebalancing | Avg CAGR | Avg Calmar |
|---|---|---|
| Weekly | -1.87% | -0.020 |
| Monthly | 7.65% | 0.108 |
| 3M | 9.95% | 0.197 |
| 6M | 13.03% | 0.338 |
| 12M | 12.44% | 0.470 |
Weekly rebalancing produces an average CAGR of -1.87%. The strategy loses money on average before the benchmark earns anything. At 0.03% per side, a full portfolio rotation every week compounds into a drag that no momentum signal can survive. You are paying roughly 3% per year just in transaction costs at weekly frequency, and the tax on every small gain on top of that.
Monthly rebalancing recovers to 7.65% but still sits well below the 11.8% benchmark average. 3M is better but still below. 6M is where momentum becomes productive on average, and 12M is close behind with better risk adjustment.
The 6M cluster edges out 12M on raw CAGR because it captures momentum turning points slightly faster. But 12M produces better Calmar ratios because it means one full portfolio turnover per year instead of two, which reduces both the transaction cost drag and the capital gains tax realised annually.
This finding held strongly enough that a follow-up test using a volatility-adjusted momentum signal was run using only 6M and 12M rebalancing. Monthly and weekly were dropped entirely before a single combination was run.
What Stop-Losses Actually Do
Without a trailing stop-loss, the average maximum drawdown across 100 combinations is 74.4%. That is worse than the benchmark's 70.3%. Raw momentum concentrates into past winners and rides them down in crashes. The 2008 drawdown for the best no-stop combinations was 60 to 75%.
| Stop-Loss | Avg CAGR | Avg Max DD | Avg Calmar |
|---|---|---|---|
| None | 9.0% | -74.4% | 0.126 |
| 15% | 5.9% | -45.6% | 0.256 |
| 20% | 8.4% | -51.1% | 0.265 |
| 25% | 9.7% | -57.3% | 0.228 |
The 15% stop is the one that looks counterintuitive. It is tighter than 20% but produces lower CAGR, not higher. A 15% trailing stop whipsaws out of positions during normal corrections that then recover, triggering a taxable exit and a buy-in at a higher price. In trending momentum stocks, intraday and weekly swings of 10 to 15% are common. The stop fires too early and too often.
The 20% stop is better calibrated. It allows normal corrections to pass through and exits in sustained drawdowns when the trend has genuinely broken. The 25% stop accepts larger interim losses in exchange for staying in positions longer, which adds CAGR but also adds drawdown.
The best combinations by Calmar almost all use a 20% stop combined with 12M rebalancing. The top result is 40 stocks, 9M lookback, 12M rebalancing, 20% stop: 14.76% CAGR, -18.76% maximum drawdown, Calmar 0.787. The benchmark's 70.3% maximum drawdown cut to 18.76% while delivering 14.76% CAGR against 11.8%. That is a meaningful improvement on both dimensions.
Portfolio Size and Lookback Window
Both matter less than the two parameters above.
Larger portfolios are marginally better on average. 50 stocks averages 8.71% CAGR; 10 stocks averages 7.17% across all 400 combinations. The spread narrows considerably once you filter to the efficient 12M-rebal + 20% stop cluster, where portfolio size of 30 to 50 is largely interchangeable.
Lookback is similarly flat above 3 months. The 3M lookback produces 6.82% on average; 6M, 9M, and 12M are all between 8.66% and 8.74%. Shorter lookback is more reactive and noisier. The signal turns over faster, which means more churn and more tax events even at the same rebalancing frequency. 6M or 9M lookback in the efficient parameter zone performs roughly the same as 12M.
When Momentum Beats the Benchmark and When It Does Not
The year-by-year breakdown has a clear pattern. Momentum has one reliable strength and two predictable failure modes.
The strength is correction years. In 2011, when the benchmark fell 35.7%, 100% of all 400 combinations beat the benchmark. In 2019 (benchmark -8.5%), 83% won. In 2008 (benchmark -61.9%), 55% outperformed. The trailing stop-loss is doing most of this work, cutting exposure early in a drawdown while the benchmark falls the full distance.
The first failure mode is post-crash recovery years. In 2009, the benchmark rallied 138.8% off the crash low. Zero of the 400 combinations beat it. This is the momentum crash: the stocks that led the preceding bull market, which momentum held through the crash, are not the ones that lead the recovery. The recovery is dominated by the beaten-down stocks that momentum systematically avoids. The stop-loss had already exited much of the portfolio by then, and what remained was the wrong half of the market.
The same failure appears in 2010 (12% of strategies beat the benchmark), 2012 (20%), 2016 (8%), and 2021 (25%). None of these are crash years. They are either low-dispersion sideways markets where there is no real spread of past returns to exploit, or early bull-run years where broad participation means everything goes up together and concentration hurts.
| Year | Benchmark | % of 400 Strategies Beating BM |
|---|---|---|
| 2006 | +5.6% | 36% |
| 2007 | +65.8% | 54% |
| 2008 | -61.9% | 55% |
| 2009 | +138.8% | 0% |
| 2010 | +19.6% | 12% |
| 2011 | -35.7% | 100% |
| 2012 | +37.1% | 20% |
| 2013 | -9.3% | 64% |
| 2014 | +59.1% | 29% |
| 2015 | +5.5% | 31% |
| 2016 | +2.0% | 8% |
| 2017 | +49.1% | 60% |
| 2018 | -21.8% | 56% |
| 2019 | -8.5% | 83% |
| 2020 | +24.7% | 66% |
| 2021 | +47.8% | 25% |
| 2022 | +0.7% | 10% |
| 2023 | +40.2% | 65% |
| 2024 | +21.8% | 34% |
| 2025 | -0.3% | 16% |
| 2026 | +2.5% | 51% |
The 2009 result is important to sit with. It is not a close call. All 400 combinations, including the ones with 12M rebalancing and no stop-loss that would have stayed fully invested throughout the crash and recovery, failed to beat a 138.8% benchmark return. Momentum captures trends in motion. 2009 was a trend reversal of historic speed. The signal was pointing in exactly the wrong direction.
The Best Raw Momentum Combinations
Best by CAGR: 50 stocks, 6M lookback, 12M rebalancing, 25% trailing stop. CAGR 16.63%, max drawdown -31.39%, Calmar 0.530.
Best by Calmar: 40 stocks, 9M lookback, 12M rebalancing, 20% trailing stop. CAGR 14.76%, max drawdown -18.76%, Calmar 0.787.
The CAGR leader and Calmar leader are different combinations for a reason. The 25% stop lets more of the momentum run, adding returns in good years at the cost of larger drawdowns. The 20% stop cuts losses faster, trading roughly 1.9 percentage points of CAGR for a 12.6 percentage point improvement in maximum drawdown.
The consistent cluster across the top combinations: 30 to 50 stocks, 6M or 9M lookback, 12M rebalancing, 20 to 25% trailing stop. These four parameters together almost always produce results in the 14 to 17% CAGR range with drawdowns under 35%.
The Verdict
130 of 400 combinations beat the benchmark CAGR of 11.8% after costs and tax over 20 years. The ones that did were concentrated in one corner of the parameter space: long rebalancing cycles, trailing stop-losses, and portfolios of 30 stocks or more.
The single most important finding is that rebalancing frequency dominates everything. The average CAGR across the 320 combinations with monthly or longer rebalancing is 10.77%. The average across the 80 weekly combinations is -1.87%. If you take weekly rebalancing out of the test entirely, the strategy looks considerably more attractive on average.
Momentum works on the Nifty 500 universe when you give it room to work. Short cycles and tight stops kill it through costs. The signal itself, past returns as a predictor of near-future returns, is real and persistent across 20 years. But it requires patience at the portfolio level to capture it.
The one thing momentum does not fix is the crash-recovery year. The 2009 result is a structural feature of the approach, not a parameter choice. You can choose any combination of portfolio size, lookback, rebalancing frequency, and stop-loss you like, and if the market rallies 100%+ off a crash in a single year, the momentum portfolio will underperform. Every practitioner using this approach should know going in that this is what the bad years look like, and that 20 years of data still show a net positive outcome despite them.
Appendix: Assumptions and Methodology
Data and period: Nifty 500 universe, daily OHLC data. Test period March 2006 to May 2026 (approximately 4,983 trading days, up to 1,291 stocks in the universe).
Benchmark: Nifty 500 equal-weight index. CAGR 11.8%, max drawdown -70.3%, Calmar 0.167 over the full period.
Signal: Total return of each stock over the prior N trading days (63, 126, 189, or 252 days). Cross-sectionally percentile-ranked to [0, 1] at each rebalance date. Top N stocks selected.
Execution: Signal observed at day T close. Position entered at day T+1 open. Trailing stop-loss tracked daily from entry peak price. Gap-stop exits at open if open is already below stop level. Intraday-stop exits at close if close crosses the stop during the session.
Transaction cost: 0.03% per side on all buy and sell events.
Capital gains tax: 10% on realised profits at each sell event. Loss positions pay no tax. Cost basis tracked per position from entry.
Returns metric: CAGR from full equity curve. XIRR from actual cash-flow dates. Maximum drawdown is the largest peak-to-trough percentage decline. Calmar is CAGR divided by absolute maximum drawdown.
What this does not model: Brokerage beyond 0.03%, STT, stamp duty, market impact or slippage on mid and small caps, dividend reinvestment. The eligible universe mask does not fully replicate the survivorship bias conditions of a live portfolio.**
Attachments
- Momentum Strategy Top 20.xlsx (98 KB)
- Momentum Strategy.csv (66 KB)
Comments
Loading…
Sign in (top right) to comment.