Blending Fundamentals Cross Sectionally With Technicals All Into One Score: Generating 46% CAGR over 10 years
46.86% XIRR against a 12.04% benchmark, or ₹10 lakh turned into ₹5.34 crore. 96.2% of 25,920 combinations beat that benchmark. Neither thing this test was built to find is why. Unequal weights lost 0.79 points of median XIRR across 23,328 matched pairs, and a magnitude-preserving score lost 0.83 across 12,960.
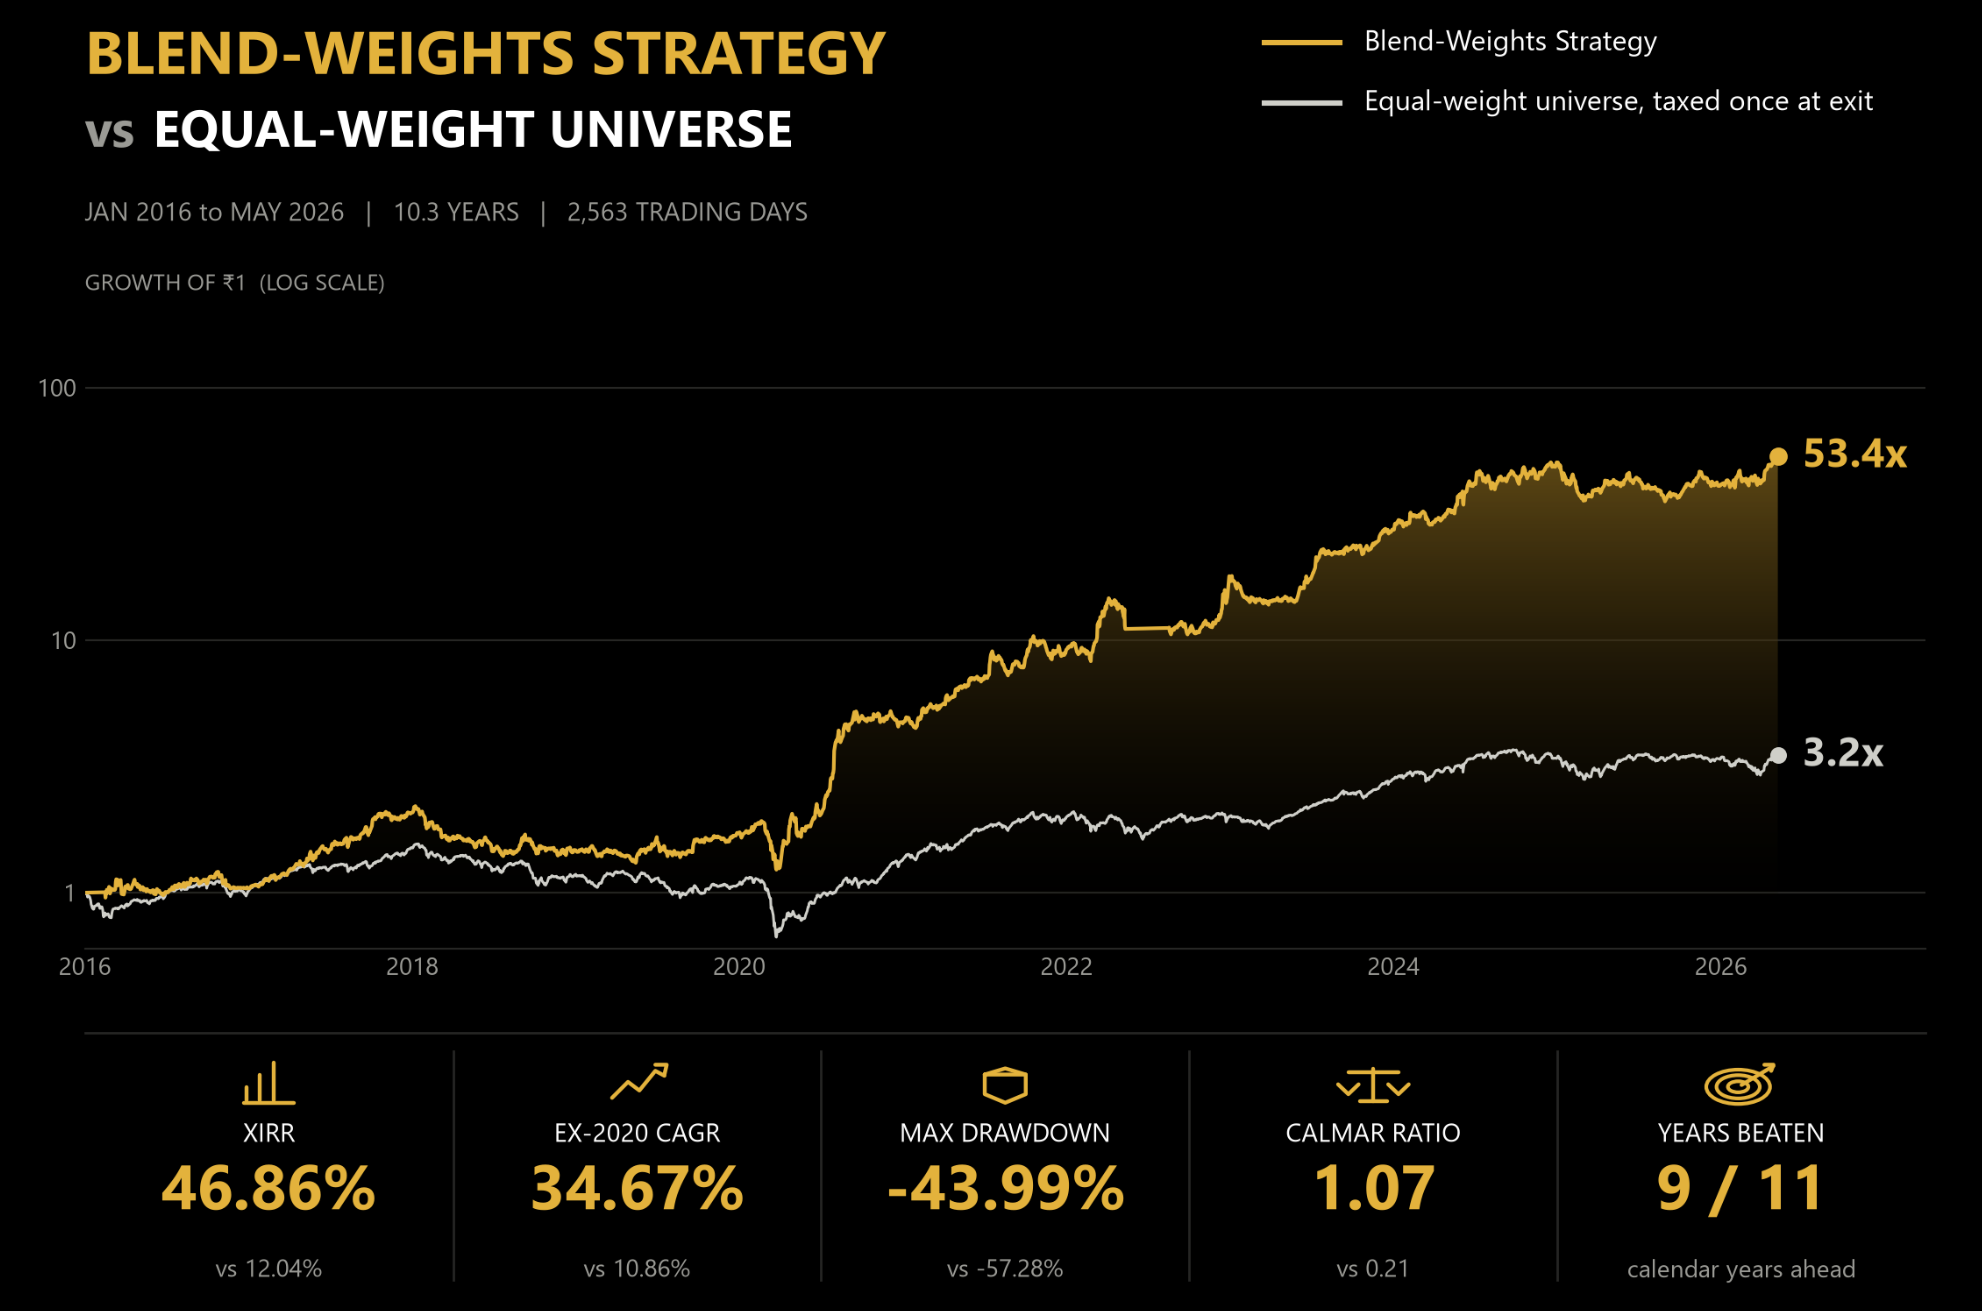
What the signal is
Every strategy scores companies by blending growth metrics. Revenue growth, profit growth, margin change and operating leverage are each measured over some number of reported quarters, turned into a cross-sectional percentile rank, and averaged. The top slice goes to a price gate, momentum re-ranks the survivors, and the best five, ten or twenty are held. Strategies 21 to 23 spent 44,000 simulations asking what to blend. This grid asks how much weight each piece should carry, and whether rank or z-score is the better way to combine them.
Why the top 10 all look alike
Look closely at the leaderboard and a pattern jumps out: eight of the ten rows use rev@3+prof@4 or a close relative, seven of ten hold five names, and every single one uses the rank transform. This isn't ten different ideas that happened to work — it's one idea (revenue-and-profit, five-name, short lookback) surfacing repeatedly under small variations in how hard you tilt it.
The year-by-year picture backs this up. The top 3 strategies didn't just have one great year — they beat the benchmark in nine of eleven years, including modest years like 2018 and 2022 where the benchmark was flat or negative.
/year_by_year_top3.png)
That consistency is what makes the top 10 more than a lucky draw. But it doesn't mean the tilting itself is what's earning the return — see below.
How rare is 42%+, really
Ten out of 6,480 combinations in this chunk cleared 42% XIRR — 0.15% of the grid. The distribution below shows where that sits: comfortably in the right tail, well clear of both the benchmark and the grid's own median of 22.5%.
/xirr_distribution.png)
Being in the tail isn't itself a red flag — some configuration has to sit there, and revenue-and-profit-led, five-name portfolios sit there consistently rather than as isolated one-off draws. But it's a reminder that "the top 10" is a description of the best 0.15%, not a description of what blending growth metrics does on average.
The return came with drawdown
None of this was free. Every top-10 row also carries a serious peak-to-trough loss — the leader draws down 37%, and two of the ten fall past 50%.
/risk_return_scatter.png)
The top 10 cluster in the upper-right of the plot: high XIRR, but also firmly in the higher-drawdown half of the whole grid. Calmar ratios (XIRR ÷ |drawdown|) for the top 10 range from 0.77 to 1.27 — good, but nowhere near proportional to how far above the benchmark's 12% they sit. Compounding at 42%+ meant sitting through a 35-55% drawdown at some point in the eleven years.
What actually moves the result — and it isn't the weighting
Here's the part that complicates the "top 10" story. Hold spec, gate, pool, size and lookback fixed and change only the weighting, and across 23,328 matched pairs, tilting cost 0.79 points of median XIRR and won only 43.5% of the time. A z-score transform did worse still — 0.83 points lost against the rank it replaced, across 12,960 pairs.
One tilt survives as a net positive, and it's the same signal that dominates the leaderboard: revenue-led tilts gain +0.45 points median across 9,504 pairs and win 53.5% of the time. Every other lead metric loses — profit -0.85, margin -2.13, operating leverage -2.40.
/tilt_lead_metric_boxplot.png)
Read the leaderboard again with this in mind: row 3 in the original grid (43.47% XIRR, equal weights, best Calmar at 1.38) is Strategy 23's blend, completely untilted. It isn't the best absolute return, but it's the grid's best risk-adjusted result, and it needed none of the tilting that the other nine rows carry. The finding isn't "tilt aggressively and get 42%+." It's "equal weights already gets you most of the way there, and if you tilt at all, tilt gently toward revenue."
The data underneath these numbers changed
Every strategy here assumed quarterly results become public a flat 45 days after quarter-end. For 2020 that was wrong. SEBI suspended the ordinary filing deadlines during the first lockdown: the March-2020 quarter wasn't due until 31 July 2020, and the June quarter not until 15 September. The flat lag handed the selector March-quarter results from 15 May — 77 days before any company had to file them — while the market was still repricing the crash. Both relief dates are now hardcoded in the data store, and this grid is built on the corrected version.
The correction reshuffles rather than deflates: anchor rows moved between -4.74 and +4.99 points of XIRR, with a median shift near +0.4. So how dependent is this leaderboard on 2020 specifically?
/2020_dependency_scatter.png)
Spearman correlation between a row's 2020 return and its full-window XIRR is +0.497 on this chunk. That's real, but it's a moderate correlation, not a near-1.0 one — plenty of rows with unremarkable 2020 returns still land high, and the year-by-year chart above shows the top 3 winning most other years too. 2020 inflated the leaderboard; it didn't create it.
Where it still fails
995 of 25,920 combinations across the full grid lost to the benchmark, and the worst returned -2.35%. Margin-led blends are the disqualifier at 19.56% median XIRR against 23.84% for revenue-led — a margin change is a ratio of two small differences, so its cross-section fills with tiny denominators and noisy ranks. 2025 broke every top row in this chunk: all three lost 15-24% while the benchmark was roughly flat. Rank correlation between the two halves of the backtest window is -0.096, essentially zero — leaderboard position in one half predicts almost nothing about the other half, though most of the top quartile does repeat across both.
Verdict
The top 10 are real, they're consistent across most years rather than a 2020 fluke, and revenue-led weighting is a genuine — if modest — edge. But the grid this leaderboard sits inside was built to test tilting, and tilting loses on average. The best absolute return needed a specific, fairly aggressive tilt; the best risk-adjusted return needed none. If you're choosing one configuration to run, that's the real trade-off — not whether 42% is achievable, but how much of the leaderboard's edge you're willing to attribute to a tilt that loses more often than it wins.
Appendix: Assumptions and Methodology
- Universe. 1,291 Indian equities, all part of an inclusion and exclusion adjusted Nifty 500 membership, 1 Jan 2016 to 8 May 2026, which is 2,563 trading days. Adjusted open and adjusted close only: there is no volume, no high and no low in this dataset, so nothing here uses an intraday range or a volume confirmation. 112 of the 1,291 names carry no price at all, being merged, delisted or gone private, and they are inert because eligibility is false on every one of their days. The price matrix is 38.7% dense overall, which is what a two-decade membership history looks like when companies enter and leave.
- Capital. A single ₹10 lakh lump sum on the first day of the window and nothing after it, so there is no contribution schedule to flatter or penalise any run. Because it is a lump sum, CAGR and XIRR are the same number, which is why the second stat tile (of the cover image) reports ex-2020 CAGR instead of repeating the first.
- The grid. 180 weighted specs by 3 portfolio sizes by 3 lookbacks by 4 gates by 2 pool depths by 2 transforms, giving 25,920 runs across four workbooks of 6,480 each, one per pool and transform pair. The 180 specs are 12 two-term blends at 9 weight rungs plus 6 three-term blends at 12 rungs. Sizes are 5, 10 and 20 names, lookbacks 63, 126 and 252 days, pools the top 2x or 3x of the target size. 24,925 of the 25,920 runs, or 96.2%, beat the benchmark. Grid median is 22.19% XIRR and 20.11% ex-2020 CAGR, which is the distribution the headline row is drawn from.
- Benchmark. A costlessly daily-rebalanced equal-weight portfolio of the eligible universe, bought once net of cost and taxed once at exit: 12.04% XIRR, -57.28% max drawdown, 0.21 Calmar, 3.24x, ₹32.44 lakh. It is not the Nifty 500 index, and both of its simplifications flatter it, since a real index fund pays to rebalance and a real holder pays tax more than once. Its plotted curve is marked to market before liquidation, so it tips near 3.5x and is scored at 3.24x once the exit cost and the single capital gains charge are taken. The strategy curves are already net at every point, because they pay tax on each sale as it happens.
- Signal. Each term is growth over k reported quarters measured against the same k quarters a year earlier, read either as a level or as an acceleration, with k running 1 to 4. It stops at 4 deliberately: at k of 6 the current and year-ago windows overlap by two quarters and the reading quietly stops being year on year. Each term is then converted to a cross-sectional percentile rank with ties averaged, or to a z-score clipped at 4 standard deviations, and the terms are combined with relative integer weights that are normalised once at the very end. Quality floors apply per quarter counted: ₹10 crore of quarterly revenue, and a ₹1 crore floor on the prior-year profit base so a recovery from near zero does not read as infinite growth. Growth outside ±200% makes a name unusable rather than being clipped into the band, a margin change is bounded at 100 fraction points, and a name must be usable on every term to be usable at all. Filling a missing term with the median would let a company with no comparable history score as average, and average is a passing grade in a top 2x pool.
- Point-in-time fundamentals. A quarter's figures become visible only after its filing date, never on the quarter end. The 2020 filing relief is hardcoded rather than approximated: the March 2020 quarter is not available until 31 Jul 2020 and the June quarter not until 15 Sep 2020, because the ordinary deadlines were suspended during the first lockdown. A flat 45-day lag would have put the March quarter at 15 May 2020, a 77-day lookahead into the single most consequential window in the dataset.
- Selection, in order. Score the eligible universe on the blend, take the top 2x or 3x of the target size, apply the price gate, then re-rank the survivors on momentum and hold the best x. The gate is asymmetric by construction, written as entry then exit, so a name has to clear a tighter line to be bought than to be kept.
- Pinned, with evidence. None of these is carried as an axis, and each was fixed on a measured margin in an earlier grid rather than on preference. Band
excl: Strategy 23, 12,096 matched pairs, where winsorising instead cost 1.06 points of median XIRR and 1.55 points of median ex-2020 CAGR and took median Calmar from 0.389 to 0.314. Volatility adjusted momentum: Strategy 22 measured the whole momentum family axis at 0.01% of total XIRR variance. The 20% trailing stop, taken off each position's own peak close: Strategy 22 measured the structural alternative at 2.21 points worse on 68.5% of matched pairs. Earnings refresh rebalancing: Strategy 21 gave it 48 of its top 50 rows. Position management is likewise fixed, with survivors kept rather than sold and re-bought at a rebalance, stop proceeds spread across the surviving names in proportion to each lot's own gain since entry, and a per-name cap at twice equal weight. - Matched pairs, which is how every claim above is measured. The maximum of 25,920 draws grows with the draw count under pure noise, so an axis is judged by holding everything else fixed and comparing. Weights: 23,328 pairs against their own all-ones baseline, median -0.79 points of XIRR, tilts winning only 43.5% of the time. Transform: 12,960 pairs, z-score minus rank, median -0.83 points, z winning 43.7%. Pool depth: 12,960 pairs, 3x minus 2x, median +0.24 points on 51.7%, which is the one axis that is close to a coin flip.
- The 2020 problem, stated rather than buried. Across all 25,920 rows the 2020 calendar return correlates +0.600 with full-window XIRR and -0.034 with ex-2020 CAGR. A rank-1 row is therefore mostly a statement about one year. That is why the ex-2020 figure sits beside the headline everywhere in this piece, and why the leader's 46.86% should be read next to its 34.67%.
- Execution and costs. Every decision is taken at a day's close and filled at the next open, so no trade uses a price that was not yet observable. 0.03% per side on every buy and sell. A flat 10% capital gains tax on the realised gain of each sale, charged as it happens rather than deferred. Idle cash earns 5% a year, compounded daily. Survivors are held intact rather than topped up to the new target weight, which is a deliberate simplification that avoids tax lot accounting and leaves some weight drift.
- Metrics. XIRR from two dated cashflows, the initial outlay and the final value. Maximum drawdown on the daily wealth curve, peak to trough. Calmar is XIRR divided by the absolute value of maximum drawdown. Ex-2020 CAGR compounds the ten annual return columns other than 2020 and annualises the result. The split columns divide at the trading day nearest five years before the window end, so they cover Jan 2016 to May 2021 and May 2021 to May 2026 despite the legacy "15Y" and "5Y" headers, which are inherited from an older and longer era of this project.
- Not modelled. Dividends, sector neutrality, market impact, borrow cost, and the statutory Indian capital gains schedule, which distinguishes short from long holdings and has changed rate several times over the window. Tax here is a flat 10% on every gain, which is a simplification in both directions. One further known optimism: when a held name has no usable price on the day it is sold, the engine falls back to that position's running peak close, which books wealth on a series that had already stopped trading.
Attachments
- the final latest one.xlsx (2511 KB)
Comments
Loading…
Sign in (top right) to comment.